The World of Hyatt award chart is about to get much more complicated.
This May, Hyatt’s three-tier award pricing system of Off-peak, Standard and Peak pricing is retiring. We’ll see a five-level model roll out in its place, with the following redemption zones:
- Lowest
- Low
- Moderate
- Upper
- Top
While Hyatt is maintaining its eight hotel categories and separate award charts for all-inclusive and Miraval resorts, these five new tiers have raised the ceiling for many redemptions at top-tier properties.
To put it frankly, the upcoming changes will likely make some of our favorite points sweet spots a little less sweet during peak seasons.
With this in mind, we’ve rounded up 10 of our favorite properties you should consider booking now — before the changes go into effect this May.
Related: 22 best Hyatt hotels in the world to book with points
Alila Ventana Big Sur
- Hotel award category: 8
- New standard room Top pricing: 75,000 points
- Previous standard room Peak pricing: 45,000 points
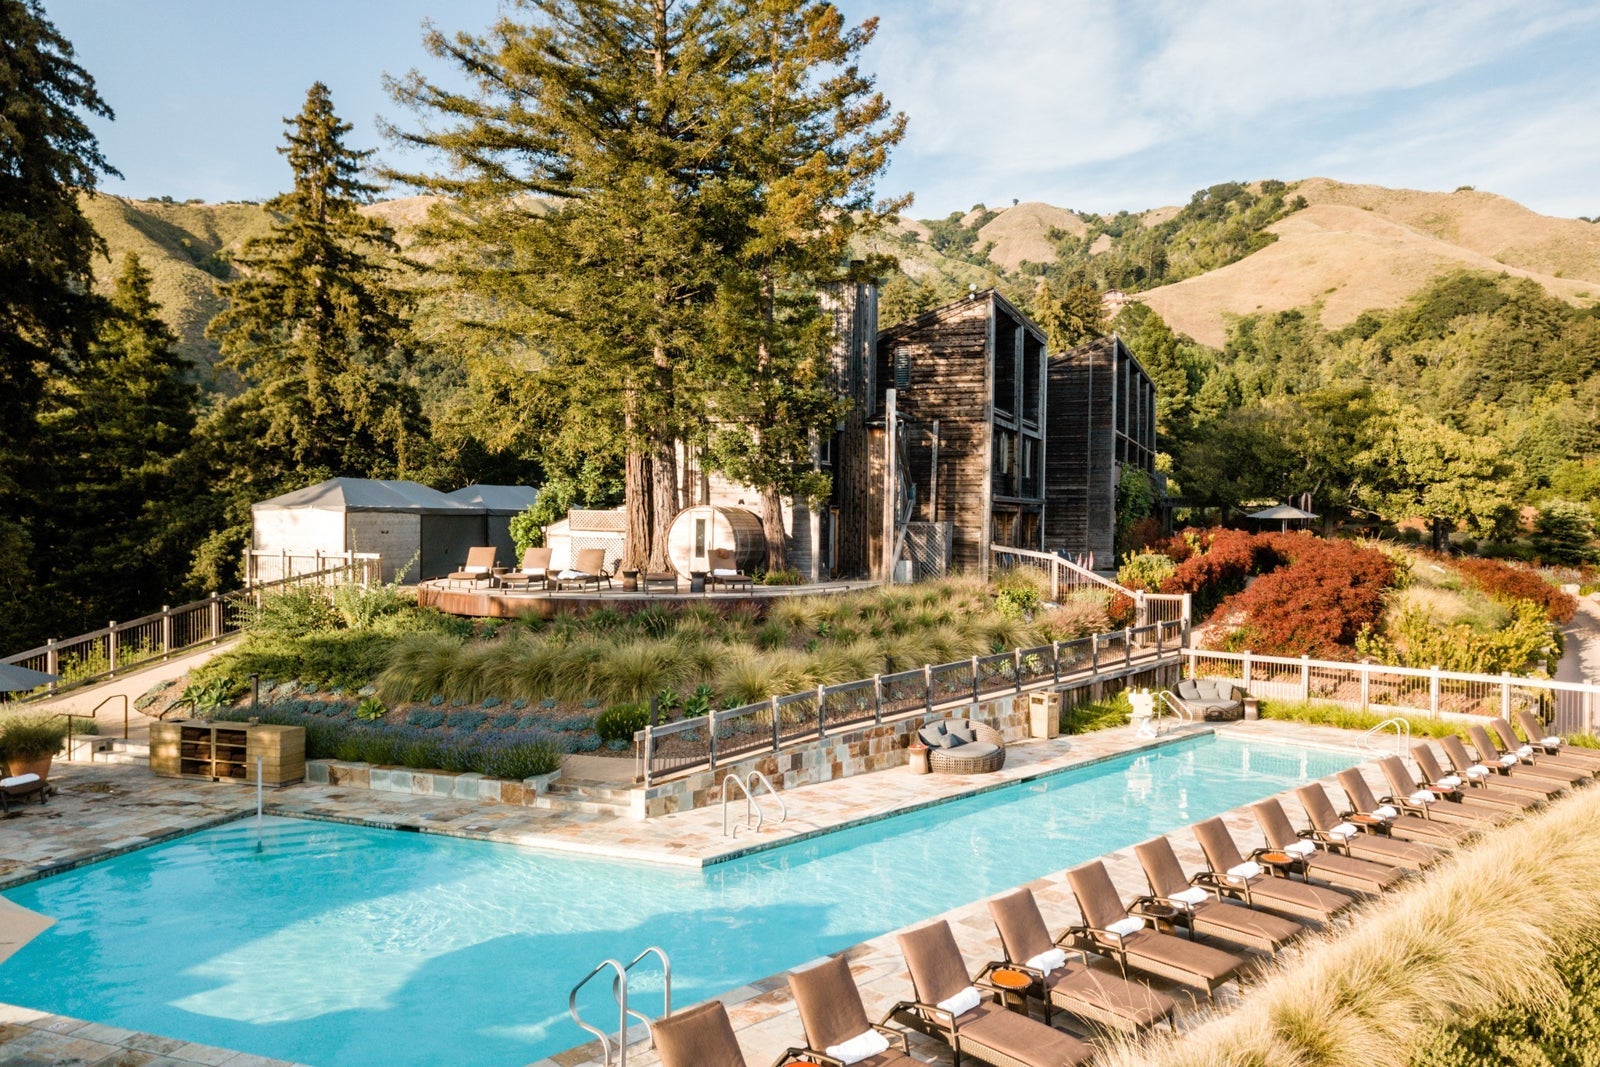
Guests can truly unplug and unwind at California’s secluded Alila Ventana Big Sur. All stays here include meals, snacks and nonalcoholic beverages.

Reward your inbox with the TPG Daily newsletter
Join over 700,000 readers for breaking news, in-depth guides and exclusive deals from TPG’s experts
However, award prices are going up. Previously, the highest amount you’d redeem for a standard room at a Peak rate was 45,000 points. Now, a night during the Top redemption period reaches 75,000 points — a 30,000-point difference.
If you’re considering a stay here in summer or early fall, you may run into these Top-tier redemption rates.
Related: Sardines, Steinbeck and sea otters: TPG’s guide to exploring Monterey, California
Andaz Maui at Wailea Resort
- Hotel award category: 8
- New standard room Top pricing: 75,000 points
- Previous standard room Peak pricing: 45,000 points
Stays at Hawaii’s Andaz Maui at Wailea Resort are chic, elevated and stylish. The food options, including a breakfast buffet and poolside snacks, are a true highlight.
When Hyatt’s award chart changes go into effect, one night here could reach 75,000 points in the high season. Previously, it peaked at 45,000 points.
We anticipate the highest rates kicking in around summer and early fall, so be on the lookout if you’re planning to visit at these times.
Related: The 18 best hotels on Maui, from luxury stays to family-friendly resorts
Park Hyatt Beaver Creek Resort and Spa
- Hotel award category: 8
- New standard room Top pricing: 75,000 points
- Previous standard room Peak pricing: 45,000 points

Hyatt loyalists can enjoy an authentic ski vacation at Colorado’s Park Hyatt Beaver Creek, one of our favorite ski hotels. It’s known for its fantastic location and ample on-site and nearby activities, such as ice skating, shopping and dining.
Top-tier nights here could reach as high as 75,000 points, when it previously peaked at 45,000 points.
You’re likely to see the highest rates around ski season and winter holidays.
Related: The best ski resorts in the US for your next trip to the slopes
Park Hyatt New York
- Hotel award category: 8
- New standard room Top pricing: 75,000 points
- Previous standard room Peak pricing: 45,000 points

One of the best ways to experience New York City in luxury is a stay at the Park Hyatt New York. From its gorgeous saltwater pool to beautiful guest rooms with breathtaking views, there’s a lot to enjoy here.
It could get much pricier to stay here on points, as Top-tier nights could reach 75,000 points instead of the previous Peak rate of 45,000 points.
New York’s high travel seasons can vary, but when visitors flock to the Big Apple in early fall and during winter holidays, redemption rates may reach the Top level.
Related: The 24 best hotels in New York City
Park Hyatt Sydney
- Hotel award category: 8
- New standard room Top pricing: 75,000 points
- Previous standard room Peak pricing: 45,000 points

If you’re heading to Australia, the Park Hyatt Sydney is a stellar choice for your accommodations. Guests receive access to private balconies with views of Sydney Harbour and can enjoy one of the city’s rare rooftop pools.
This is another property where Top-tier nights could cost 75,000 points per night, up from the previous Peak rate of 45,000 points.
You may encounter these Top redemption rates throughout the Australian summer (i.e., the Northern Hemisphere’s winter season).
Related: Best Park Hyatt hotels, according to Globalists
Park Hyatt Tokyo
- Hotel award category: 8
- New standard room Top pricing: 75,000 points
- Previous standard room Peak pricing: 45,000 points

The iconic Park Hyatt Tokyo, of “Lost in Translation” fame, stands tall over the city, occupying the floors between the 29th and 52nd stories of the Shinjuku Park Tower. With luxurious rooms that showcase pared-back Japanese design and a dining program that celebrates Japanese cuisine, this Park Hyatt outpost offers guests a truly elevated hotel experience.
Top nights here can now reach 75,000 points per night under Hyatt’s new award chart, up from 45,000 points with its previous Peak rate.
If you’re considering a trip during spring’s cherry blossom season or the autumn foliage season, don’t be surprised if you’re subject to Top-tier redemption rates.
Related: The 11 best hotels in Tokyo for your next Japan getaway
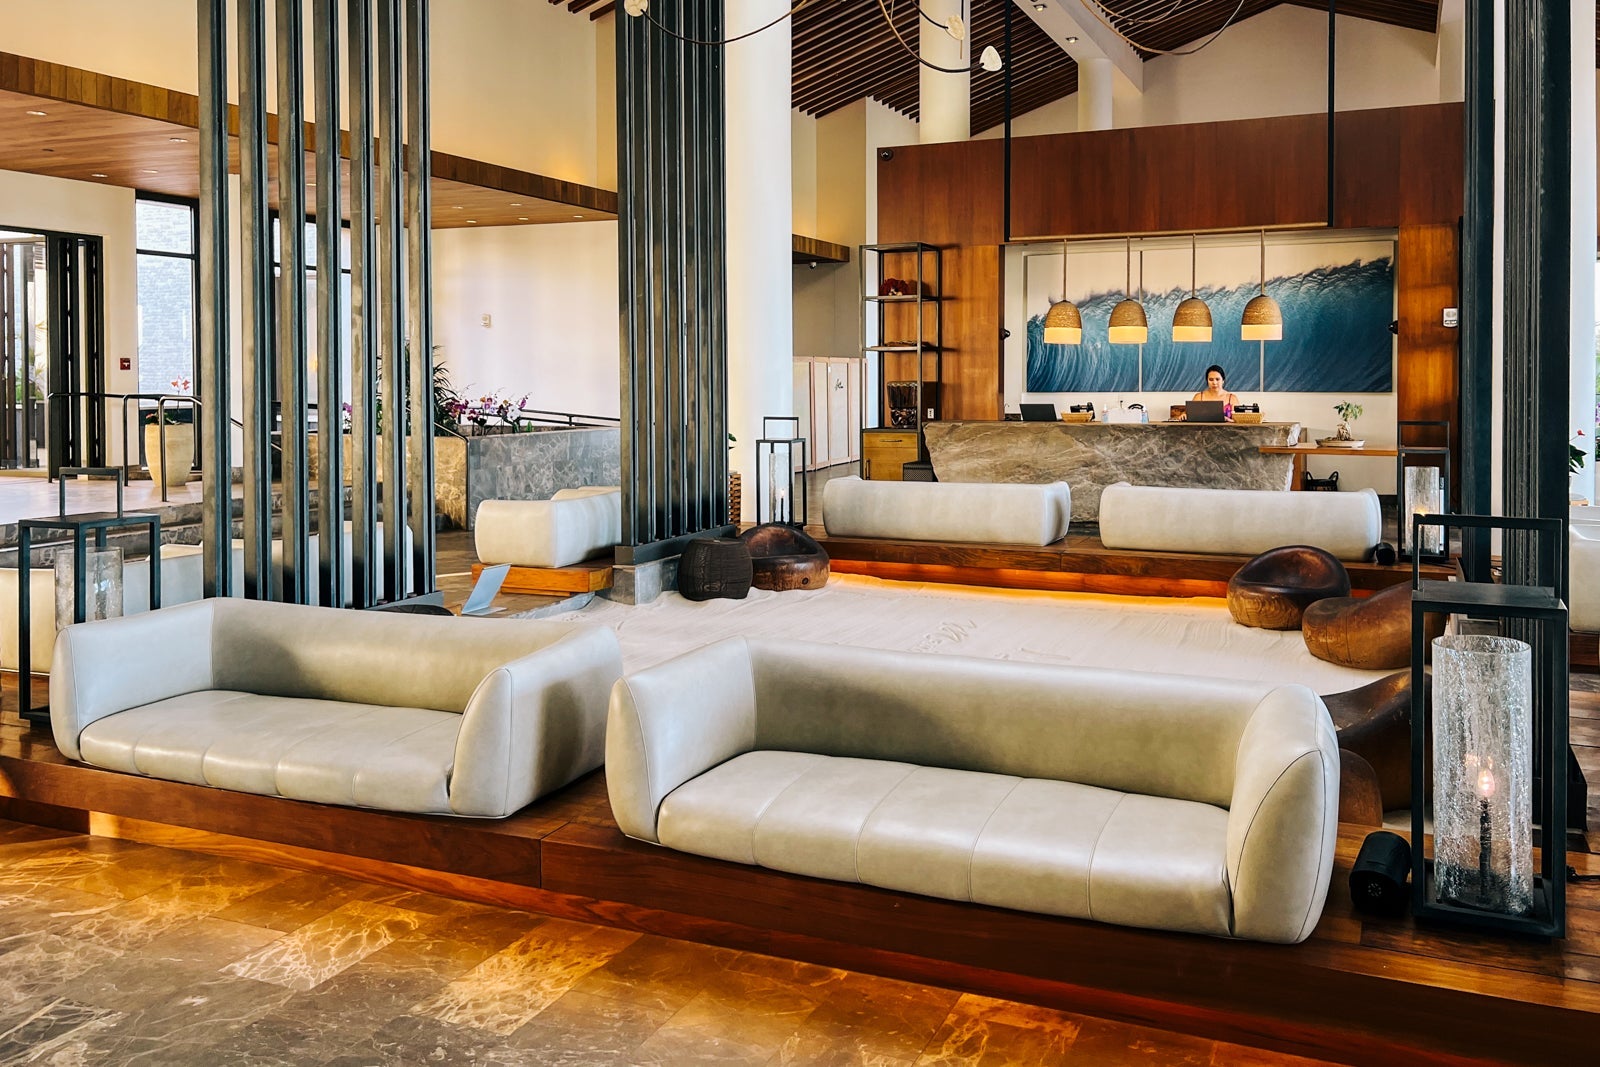
Impression Moxche by Secrets
- Hotel award category: F
- New standard room Top pricing: 85,000 points
- Previous standard room Peak pricing: 58,000 points
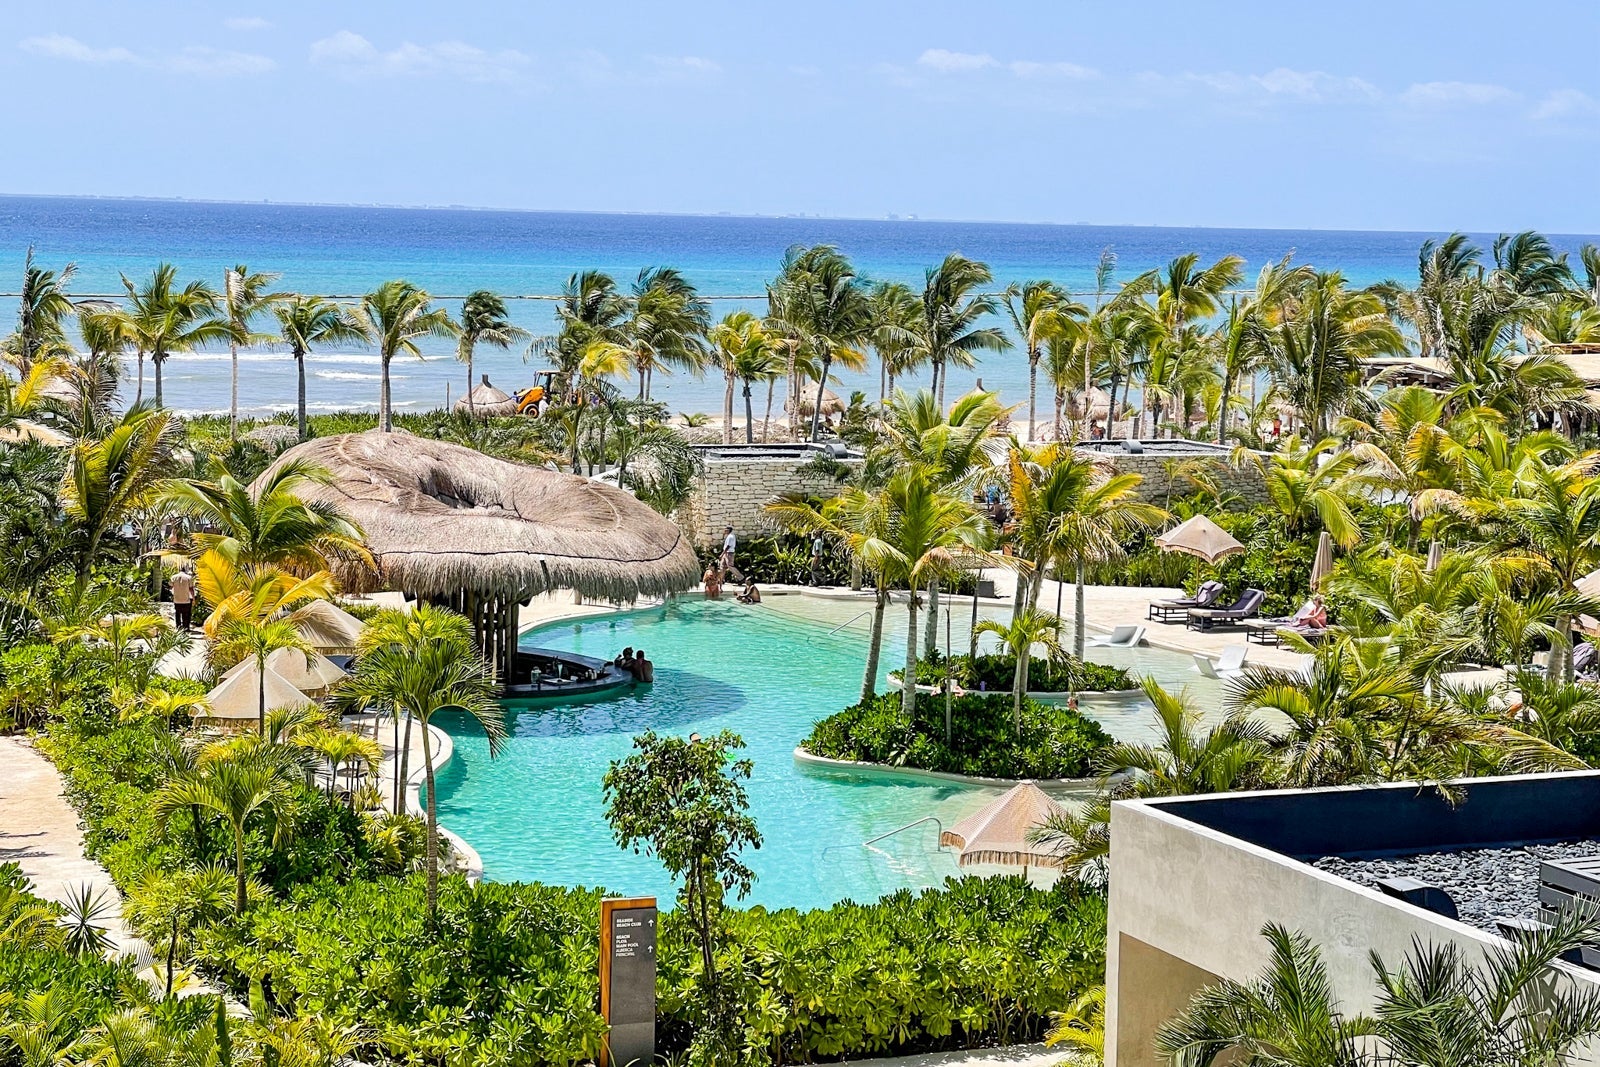
You can redeem Hyatt points for incredible all-inclusive resort vacations. Impression Moxche by Secrets is a luxe seaside retreat in Playa del Carmen, Mexico, with large rooms that feature tropical ocean views.
A night here priced at the Top level under Hyatt’s new award chart could require as many as 85,000 points. Previously, the Peak rate didn’t exceed 58,000 points.
These rates are likely to go up during popular travel seasons, such as winter and summer breaks.
Related: The 14 best Hyatt all-inclusive resorts in the world
Miraval Austin Resort and Spa
- Hotel award category: Miraval category
- New standard room Top pricing: 75,000 points
- Previous standard room Peak pricing: 50,000 points

Relaxation and restoration are at the forefront when you stay with Hyatt’s Miraval brand. The Miraval Austin is an elegant Texan escape highlighted by tranquil guest rooms and wellness-focused amenities.
A Top-tier night here could now cost up to 75,000 points, up from its previous Peak rate of 50,000 points.
We would expect these top rates to come into play during ideal weather seasons, such as spring and fall.
Related: The 13 best resorts in Texas for a Lone Star State getaway
Alila Kothaifaru Maldives
- Hotel award category: 7
- New standard room Top pricing: 55,000 points
- Previous standard room Peak pricing: 35,000 points
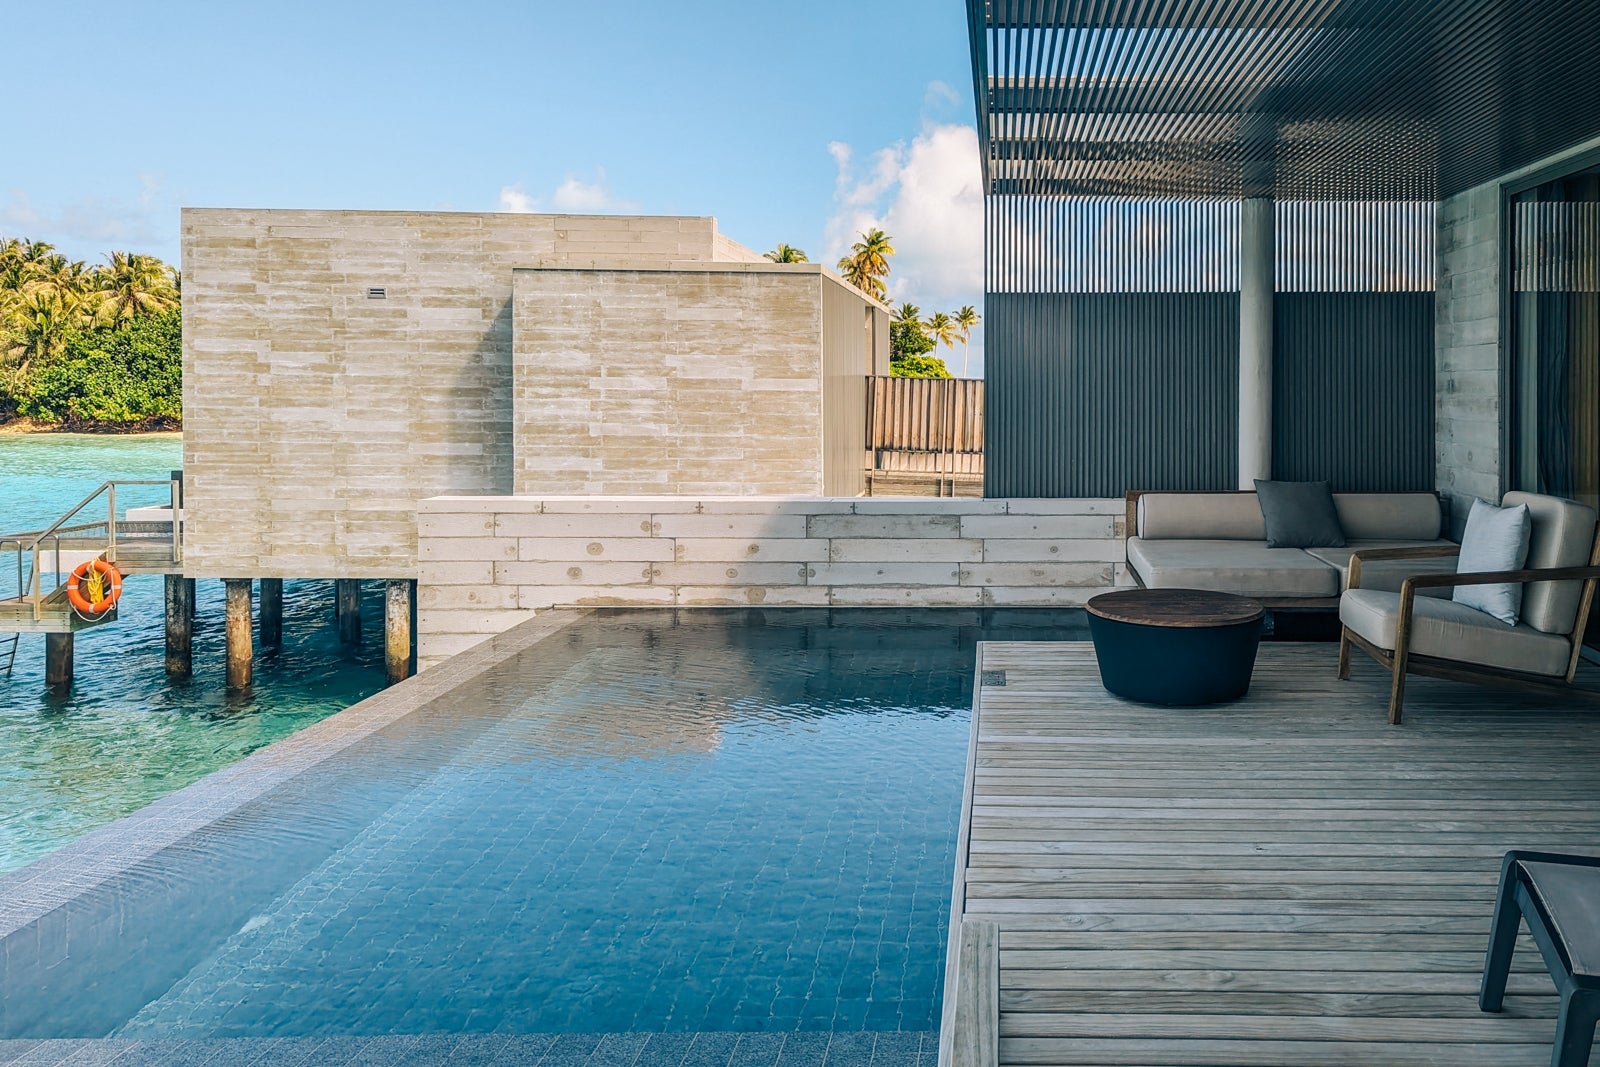
Dreaming of a trip to the Maldives? You can redeem Hyatt points for a private villa at Alila Kothaifaru Maldives, where natural beauty like banyan trees and sandy shores is front and center.
A Top-tier night here will cost up to 55,000 points. Before the award chart changes, it peaked at 35,000 points.
We expect rates to rise during the Maldives’ dry season, which runs from December to April.
Related: 34 Maldives resorts you can book with points and miles
Great Scotland Yard Hotel
- Hotel award category: 6
- New standard room Top pricing: 40,000 points
- Previous standard room Peak pricing: 29,000 points

History buffs have a lot to dive into at the Great Scotland Yard Hotel, a property named after the street where London’s Metropolitan Police headquarters once stood and positioned at the site where Jack the Ripper was interrogated.
With Hyatt’s new award chart, you would have to redeem 40,000 points for a night during the Top season. Previously, one night here peaked at 29,000 points.
You may encounter these Top rates in late spring and summer, when the weather is best in the U.K.
Related: The 25 best hotels in London
Bottom line
It’s yet to be seen how many nights will top out at the highest redemption level under Hyatt’s new award chart.
However, if you’ve enjoyed redeeming Hyatt points at these standout properties during peak season under the old chart, you may want to book that next trip before the new changes are rolled out.

Stacie Harris is a local resident and reporter of the Maple Grove area. Stacie reports on medicine and science for the Maple Grove Report.