When someone decides to buy life cover for the first time, one question comes up almost immediately.
Should it be term insurance or life insurance?
The two terms get used interchangeably in casual conversation. But they are not the same thing. Understanding the difference between term insurance and life insurance is what makes the rest of the decision easier. Including whether a 1 crore term plan is the right starting point.
Key Takeaways
Life insurance is a broad category, while term insurance is a specific type that provides pure life cover for a fixed period at a lower cost.
A 1 crore term plan offers high life cover at a low premium, making it one of the most cost-efficient options for protecting your family’s financial future.
Bundling insurance with savings or investment increases premiums but often delivers modest returns, compared to separating insurance and investment.
Choosing the right plan requires checking claim settlement ratio, solvency ratio, and policy term, ensuring long-term financial protection and reliability.
What the Two Terms Actually Mean
Life insurance is the broader category. It is an umbrella term for any policy that provides a financial payout connected to the life of the insured person. Term insurance, endowment plans, ULIPs, whole life policies, and money back plans all fall under this umbrella.
Term insurance is one specific type within that category. It provides pure life cover for a fixed period. Nothing else.
So when someone asks about the difference between term insurance and life insurance, they are usually asking how term insurance compares to the other types of life insurance – endowment plans, ULIPs, and whole life policies in particular.
How Term Insurance Works
A term insurance policy runs for a defined number of years. The insured person pays a fixed premium every year to keep the cover active. If death occurs during the policy period, the family receives the sum assured. If the person outlives the policy, it closes with no payout.
No investment. No savings. No maturity benefit in a standard plan. The premium buys life cover and nothing else.
This structure is what keeps the cost low. A 1 crore term plan for a healthy 30-year-old non-smoker typically costs between eight and twelve thousand rupees a year. That is less than a thousand rupees a month for one crore of cover.
How Other Life Insurance Plans Work
Endowment plans and money-back policies combine life cover with a savings component. Part of the premium goes towards the cover. The rest is saved and returned at maturity along with bonuses.
ULIPs combine life cover with market-linked investment. Part of the premium goes towards cover. The rest gets invested in equity or debt funds based on the policyholder’s choice.
Whole life plans provide cover for the entire lifetime of the insured person rather than a fixed term. Some also build a cash value over time.
All of these cost significantly more than a term plan for the same amount of cover. The savings or investment component that gets bundled in is what drives the premium up.
The 1 Crore Comparison
This is where the difference between term insurance and life insurance becomes very clear in real numbers.
A 1 crore term plan for a 32-year-old with a 30-year term costs roughly eight to twelve thousand rupees a year, depending on the insurer and lifestyle factors.
An endowment plan offering the same one crore cover for the same person may cost anywhere between eighty thousand to one lakh twenty thousand rupees a year or more.
The difference in premiums is enormous. The life cover provided is the same. One crore is paid to the family on death in both cases.
What changes is what happens if the person survives the term. The endowment plan returns a maturity amount. The term plan returns nothing in its standard form.
The Real Cost of Bundling Insurance With Savings
The logic behind endowment and ULIP plans sounds attractive. Pay one premium. Get life cover. Get savings or investment returns. Two things from one product.
But the actual returns from the savings component of most endowment plans are modest. After accounting for the mortality charges within the plan and the insurer’s costs, the effective return on the savings portion often works out between 4 and 6 percent per year over the long term.
A separate fixed deposit or a simple debt mutual fund usually delivers comparable or better returns with more transparency and flexibility.
The strategy of buying a 1 crore term plan and investing the premium difference separately in a mutual fund or PPF almost always produces a larger total corpus over 20 to 30 years compared to an endowment plan of the same cover amount.
This is why financial planners consistently recommend separating insurance from investment rather than bundling them.
Choosing the Right 1 Crore Term Plan
If a 1 crore term plan is the right fit, a few things determine which specific plan to go with.
The claim settlement ratio of the insurer should be above 97 percent. The amount settlement ratio should be above 95 percent. Both figures are in the IRDAI annual report.
The solvency ratio should be 2 or above. A term plan bought today may need to pay out decades from now. The insurer still needs to be around and financially stable.
The policy term should cover the full working years. A 33-year-old planning to retire at 63 needs at least a 30-year term. Shorter terms leave gaps.
Honest disclosure at the time of application is non-negotiable. Any undisclosed information that surfaces at the time of a claim can lead to rejection or the policy being voided entirely.
Conclusion
The difference between term insurance and life insurance is not complicated once the structure of each is clear.
Life insurance is the category. Term insurance is the most cost-efficient product within it. A 1 crore term plan delivers the highest cover at the lowest premium of any life insurance option available.
Other life insurance products serve specific purposes. But for most working adults who need to protect their family’s financial future, a term plan does the job better than anything else at a cost that actually fits the budget.
Want to learn the proven strategies top businesses use? Try searching ‘small business consulting‘ to connect with an expert in your area!
Frequently Asked Question
1. What is the main difference between term insurance and life insurance?
Life insurance is a broad category that includes different types of policies, while term insurance is a specific type that provides pure life cover for a fixed period with no savings or investment component.
2. Why is term insurance more affordable than other life insurance plans?
Term insurance is more affordable because it only provides life cover without combining savings or investment features. This keeps premiums low compared to plans like endowment policies or ULIPs.
3. Is a 1 crore term plan a good option for financial protection?
A 1 crore term plan is a cost-efficient way to provide financial protection for your family. It offers high coverage at a low premium, making it suitable for most working adults who want to secure their family’s future.
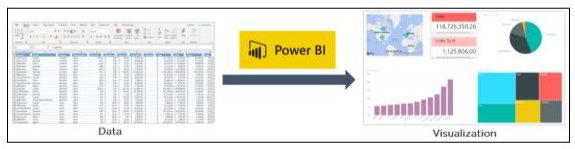
Power BI is a tool offered by Microsoft for business analytics that allows you to visualize your data and share insights. To build interactive dashboards and Business Intelligence reports, it converts data from various sources.
In the above illustration, you can see there is an excel document and we have some sales info. Power BI lets you create numerous charts and graphs to visualize the data using this information. Now that you’ve learned what Power BI is, let’s comprehend why you need Power BI.
Become a Power BI Certified professional by learning this HKRPower BI Training!
Why Power BI?
The contributing factors why Power BI is so common and essential in the BI domain are as follows:
1. Access to Data Volumes from Multiple Sources
Power BI can access large volumes of multi-source data. This helps you to view, evaluate, and display massive volumes of data that cannot be accessed in Excel. Excel, CSV, XML, JSON, pdf, etc. are some of the essential data sources available for Power BI. To import and store the data inside the “.PBIX” format, Power BI uses strong compression algorithms.
2. Features of an Interactive UI/UX
Power BI renders items visually attractive. With features that allow you to copy all formatting across similar visualizations, it has a simple drag and drop feature.
3. Exceptional Integration of Excel
Power BI assists to collect, analyze, distribute, and exchange business data from Excel. Anyone acquainted with Office 365 can easily connect to Power BI Dashboards with Excel queries, data models, and reports.
4. Boost preparation for big data with Azure
The use of Power BI with Azure enables you to analyze and exchange large data volumes. An azure data lake will minimize the time it consumes for business analysts, data engineers, and data scientists to get insights and increase collaboration.
5. Transform Insights to Action
To make data-driven business decisions, Power BI enables you to obtain insights from data and transform those insights into actions.
6. Stream Analytics in Real-Time
You will be able to perform real-time stream analytics with Power BI. For gaining access to real-time analytics, it allows you to gather data from various sensors and social media sources, so you are still able to make business decisions.
Power BI Training
Master Your Craft
Lifetime LMS & Faculty Access
24/7 online expert support
Real-world & Project Based Learning
The Architecture of Microsoft Power BI
To work together, Power BI is a business network that includes many technologies. It offers excellent solutions for business intelligence. There are four phases in Power BI Architecture. Let’s talk about these four measures that provide detailed information about each of them.
Sourcing Data
Transforming Information
Report & Publish
Creating a Dashboard
1. Data Sourcing
Power BI can deliver data from a wide variety of internet resources and types of files. To receive the information, the information can be imported into Power BI or a live service connection can be installed. If you import a Power BI file, the data sets that are compressed are limited to 1 GB. If the information collection reaches 1 GB, it is possible to use a direct query. There are two other options for huge data sets.
Power BI premium.
Azure analytics services.
List of Supported Power BI Data Sources
Files:
Excel, XML, JSON, Text/CSV,Folder and SharePoint Folder.
Database:
SQL Server Database, Access Database, SQL Server Analysis Services Database, SAP HANA Database, SAP Business Warehouse server, Amazon Redshift, Impala, Google BigQuery (Beta), Snowflake, Oracle Database, IBM DB2 Database, IBM Informix database (Beta), IBM Netezza (Beta), MySQL Database, PostgreSQL Database, Sybase Database, Teradata Database.
Azure:
Azure SQL Database, Azure SQL Data Warehouse, Azure Analysis Services database (Beta), Azure Blob Storage, Azure Table Storage, Azure Cosmos DB (Beta), Azure Data Lake Store, Azure HDInsight (HDFS), Azure HDInsight Spark (Beta).
Online Services:
Power BI service, SharePoint Online List, Microsoft Exchange Online, Dynamics 365 (online), Dynamics 365 for Financials (Beta), Common Data Service (Beta), Microsoft Azure Consumption Insights (Beta), Visual Studio Team Services (Beta), Salesforce Objects, Salesforce Reports, Google Analytics, appFigures (Beta), comScore Digital Analytix (Beta), Dynamics 365 for Customer Insights (Beta), Facebook, GitHub (Beta), Kusto (Beta), MailChimp (Beta), Mixpanel (Beta), Planview Enterprise (Beta), Projectplace (Beta), QuickBooks Online.
Other:
Vertica (Beta), Web, SharePoint List, OData Feed, Active Directory, Microsoft Exchange, Hadoop File (HDFS), Spark (Beta), R Script, ODBC, OLE DB, Blank Query.
Power BI provides a preview window for selecting columns or entities after the information is imported into the Powerbi system. If you need to edit the query, there are many transformation choices available to perform the work.
3. Report and Publish:
After sourcing and editing the data, we are ready to produce reports. Reports are the data visualizations in the form of graphs, charts, and pie charts with filters and slicers. There is also a great deal of custom visualization accessible. After generating reports, we will publish them to power bi facilities. You may also publish them on the energy bi-server assumption.
4. Dashboard Creation:
After publishing reports for Power BI services, we can build dashboards by pinning the individual elements or by pinning the page of the live report. When the report is saved when pinning the individual components, the visual retains the filter setting chosen. Pinning the Live Report page helps the dashboard user to interact with the visual by selecting slicers and filters.
Power BI Components
In Power BI, three main components play a significant role in providing Power BI capabilities.
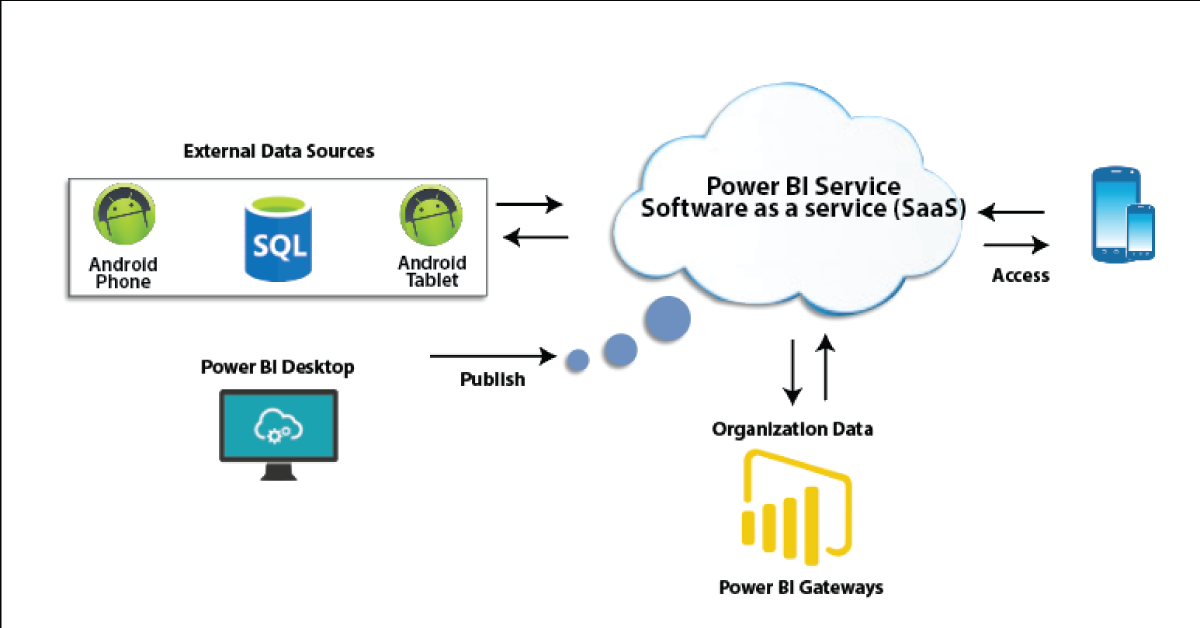
1. Power BI Desktop:
Power BI Desktop is a free application that provides your local desktop to connect, convert and visualize your data. With Power BI Desktop, you can connect to numerous different information sources and merge them (often called modeling) into a data model that allows you to build graphics and image collections that you can share as records with other people within your enterprise. Power BI Desktop is used for most users working on Business Intelligence projects to produce reports and then to exchange their reports with others using Power BI.
2. Power BI Gateway:
By connecting to your on-site data sources without moving the info, the on-site Power BI gateway can be used to keep your data fresh. It helps you to query and take benefit of current investments from large datasets. With on-site gateways, you can keep your data fresh by connecting to your on-site data sources without the need to move the data. Request huge datasets and benefit from existing investments. The gateways provide the versatility you need to meet the individual requirements and needs of your organization.
3. Power BI Mobile Apps:
You can use Power BI mobile apps to stay connected to your details from anywhere. Power BI apps are available for the Windows, iOS, and Android platforms.
4. Power BI Service:
This is a cloud service for producing accounts of Power BI and data visualization. It enables designers and BI experts to produce and distribute highly formatted, pixel-perfect reports alongside their interactive Power BI content, becoming the first cloud BI solution that blends self-service BI energy with the specifications and capabilities of conventional Enterprise BI scenarios.
There are also other modules that we should comprehend in order to benefit from Power BI’s advanced capabilities.
5. Power Query:
Data mashup and conversion instrument. With Power Query in Power BI, you can connect to several different information sources, transform the data into a format you want, and be able to quickly generate reports and ideas. When using Power BI Desktop, Power Query functionality is provided in the Power Query Editor. Power Query is made accessible through the Power Query Editor on the Power BI Desktop. To open the Power Query Editor, from the Power BI Desktop Home tab, choose Edit Queries.
6. Power Q & A:
Question and Reply Engine for Natural Language. The easiest way to get an answer from your data is often to ask a question using natural language. To explore your results, the Power BI Q & A feature allows you to use your phrases. In various papers on Power BI mobile applications and Q & A with Power BI Embedded, Q & A is discussed.
7. Power Map:
To demonstrate how the values differ in proportion across the region, the Power BI Query is used. It also displays variations in shading from dark to light. It provides a geospatial 3D tool for the visualization of data.
8. Power Pivot:
Power Pivot is a memory modeling component that allows highly compressed data storage and extremely fast aggregation and calculation of information. As part of Excel, it is also available and can be used for creating a data model inside an Excel workbook. Power Pivot can load data on its own, or data can be loaded into it by Power Query. It is extremely similar to the SSAS (SQL Server Analysis Services) tabular model, which is like a server-based Power Pivot version.
Power View is an interactive visualization platform that provides users with a drag-and-drop interface to rapidly and effortlessly construct visualizations of data in their Excel workbooks (using the Power Pivot data model).
10. SSRS Reporting services 2016:
SSRS tiles are taken to a Power BI dashboard with expected SQL Server Agent updates through the integration of SQL Serb Reporting and the Power BI Services. The tile from SSRS reports gives you this integration. Integrating SSRS reports into the Power BI service will build a connection from the Power BI dashboard to detailed SSRS reports.
Subscribe to our YouTube channel to get new updates..!
The Architecture of Power BI Clusters
Azure, Microsoft’s cloud computing platform, is the basis of the Power BI service. Power BI is currently installed in several data centers around the world, with many active deployments made available to clients in the regions served by these data centers, with an equivalent number of passive deployments serving as backups for each active deployment.
Every Power BI deployment consists of two clusters, the Web Front End (WFE) cluster, and the Back End cluster. These two clusters are seen in the following picture:
1. WFE Cluster:
To authenticate customers and provide tokens for subsequent Power BI customer connections, the WFE cluster manages the original Power BI link and authentication mechanism using AAD. The Azure Traffic Manager (ATM) is also used by Power BI to direct customer traffic to the nearest datacenter, which is determined by the DNS record of the client attempting to connect, authenticate and download static content and files. Power BI effectively distributes the appropriate static content and files to customers based on geographical location, using the Azure Content Delivery Network (CDN).
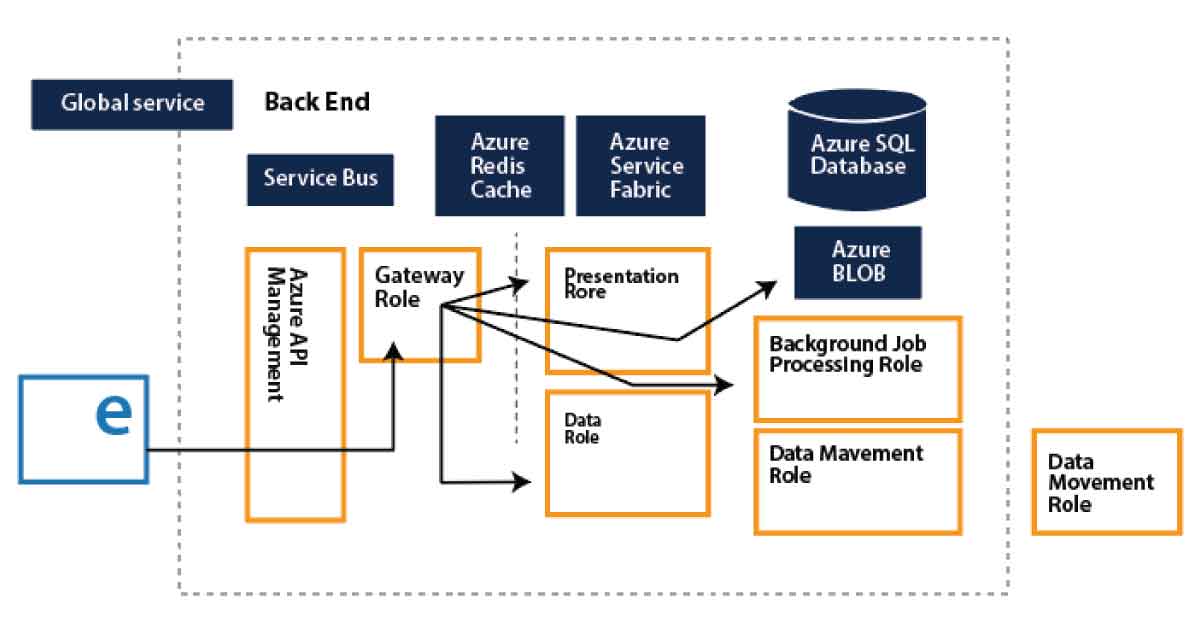
2. Backend Cluster:
The Back-End cluster is how authenticated clients interact with the Power BI service. Visualization, user dashboards, datasets, reports, data storage, information links, information refresh, and other Power BI service interaction elements are managed by the Back-End cluster. The Role Gateway works as a gateway between the demands of clients and the Power BI service. Users do not directly communicate with positions other than the gateway’s role. Azure API Management will eventually manage the gateway role.
Through its data catalog and data management gateway, Power BI integrates centralized DW / BI techniques with cloud data sources and self-service tools, as no other application has yet been able to do. And all of its functionality is bundled as a SaaS solution so that any firm can successfully incorporate and use it. In short, the adoption curve can be accelerated by Power BI and making sophisticated BI Analytics as popular as Excel itself.
Power BI offers game-changing capabilities for all BI platform stakeholders:
1. End-users:
For a long time, end users expected the ability to readily access and analyze information. To allow each worker to use data as a basis for decision making, the natural language query of Q&A and the smart visualization engine can do more.
2. BI Analysts:
Over vast volumes of data, Power Pivot gave power users the opportunity to construct successful data models, but the information required to “fit” into clean data models. Power Query’s data transformation and versatility further empower analysts to build their own end-to-end alternatives quickly.
3. IT & Data Managers:
The topic of push-pull has always been BI self-service. Everyone needs the tools and knowledge that customers need to make great choices. However, Good governance, protection, and auditing are also seen as an obstacle to change for power users. The catalog of Power BI data is interesting because it promotes self-service and governance simultaneously.
Not every business will move quickly to implement Power BI. Too much strategic change would be expressed too quickly for others. For some, there might be genuine regulatory or other factors that preclude consideration of cloud-based systems.
But it has been difficult and cost-prohibitive for many organizations to set up an open and comprehensive BI network. Power BI is really the solution that eventually renders sophisticated BI as easy to use as a search engine and generally accepted.
Power BI Training
Weekday / Weekend Batches
Conclusion
We had provided detailed information about the Power BI Architecture, its operations, and components in this blog. And we’ve also explained the Power BI service and its operation. After exploring this blog, you might have comprehended the need for Power BI in Business Intelligence, what Power BI is, and the various Power BI features. You’ve also learned about the Power BI service, the Power BI dashboard, and how the architecture looks.
To provide the best experiences, we use technologies like cookies to store and/or access device information. Consenting to these technologies will allow us to process data such as browsing behavior or unique IDs on this site. Not consenting or withdrawing consent, may adversely affect certain features and functions.
Functional
Always active
The technical storage or access is strictly necessary for the legitimate purpose of enabling the use of a specific service explicitly requested by the subscriber or user, or for the sole purpose of carrying out the transmission of a communication over an electronic communications network.
Preferences
The technical storage or access is necessary for the legitimate purpose of storing preferences that are not requested by the subscriber or user.
Statistics
The technical storage or access that is used exclusively for statistical purposes.The technical storage or access that is used exclusively for anonymous statistical purposes. Without a subpoena, voluntary compliance on the part of your Internet Service Provider, or additional records from a third party, information stored or retrieved for this purpose alone cannot usually be used to identify you.
Marketing
The technical storage or access is required to create user profiles to send advertising, or to track the user on a website or across several websites for similar marketing purposes.