Over the last decade, some of the world’s most luxurious and character-rich hotels have embraced and reimagined the all-inclusive concept. What was once a punchline has quietly evolved into a smart indulgence.
Even the most particular travelers who previously flinched at the notion of a one-size-fits-all formula — epitomized by large gated compounds in sunny destinations — are discovering just how liberating and discerning the adults-only, all-inclusive model can be.
When everything from gourmet food and fine wine to bespoke amenities and expert-led wellness pursuits is included (and nicely tallied up ahead of time), it avoids that rather irritating nickel-and-diming that can take the shine off your dream holiday. A vacation feels much more indulgent when you know the bill has been more or less handled even before you order your first margarita.
Whether you want to take a deep dive into wellness in Texas Hill Country, head to the foolproof beaches of Mexico’s Yucatan Peninsula or escape to an overwater bungalow in Fiji, there are some incredible all-inclusive, adults-only options out there. And many let you save thousands of dollars by redeeming points.
Related: Why now is the time to book an all-inclusive resort with points and miles
Impression Isla Mujeres
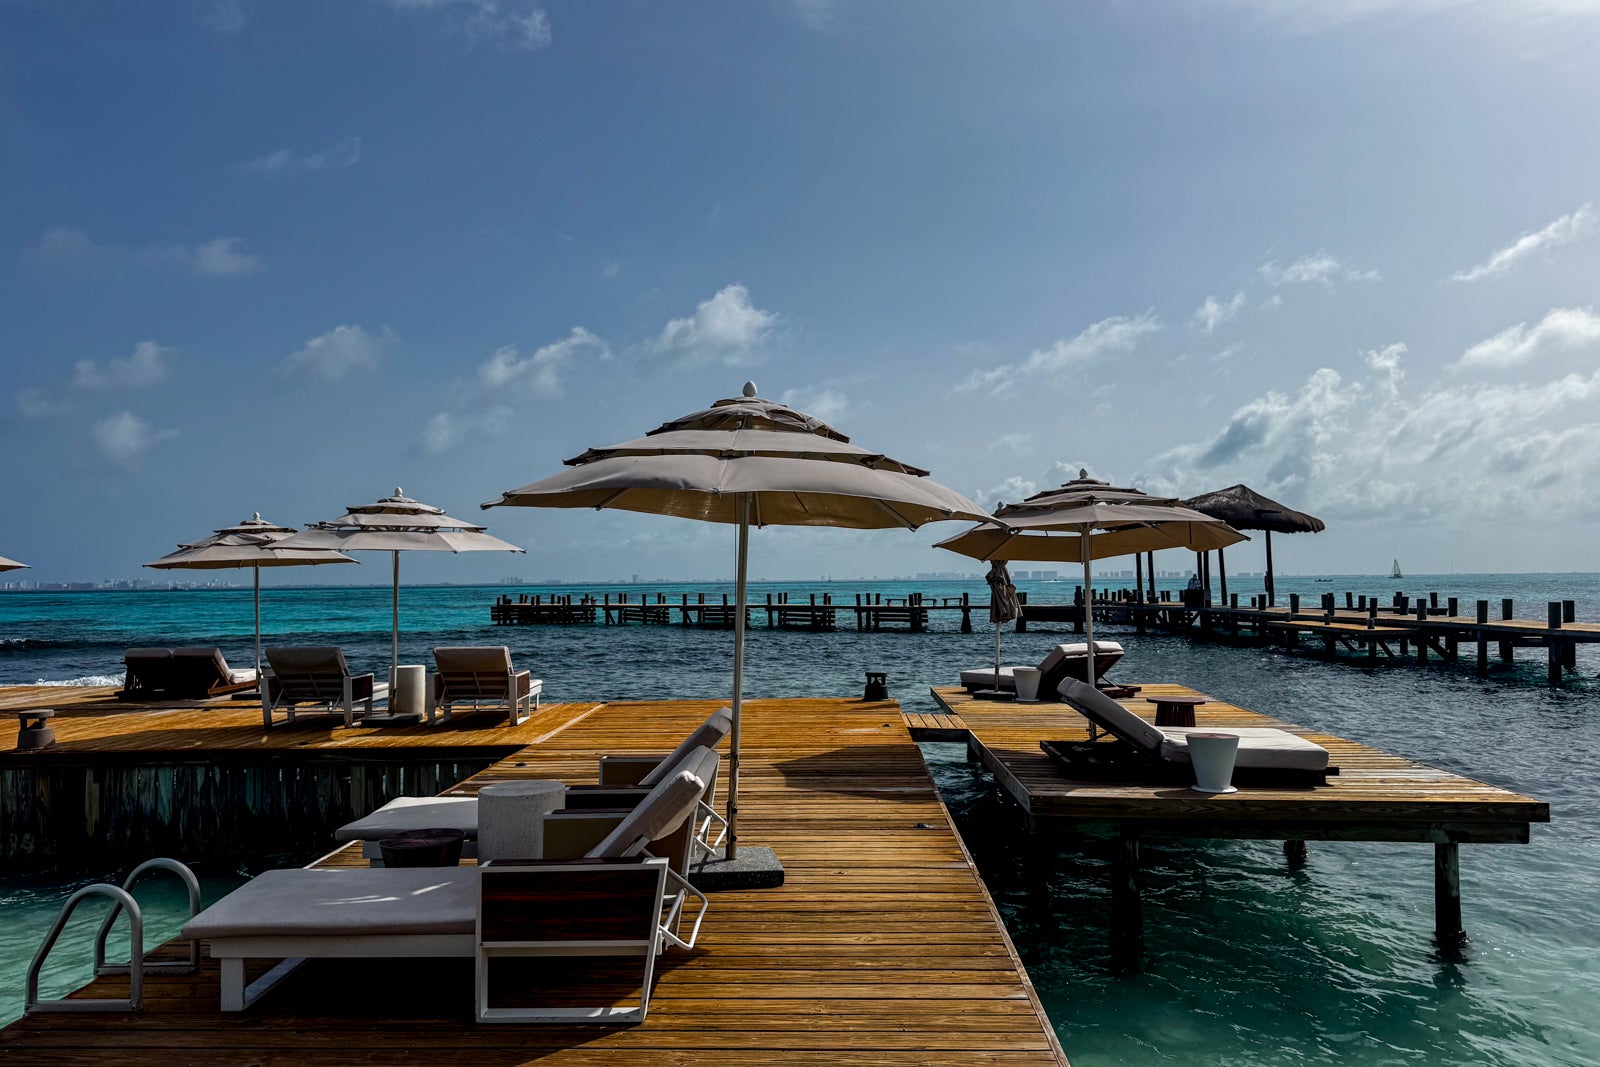
It may only be a quick (and private) 45-minute catamaran ride away from buzzy Cancun, but Impression Isla Mujeres couldn’t feel further from the hustle and bustle of the famous Hotel Zone.
Here, guests — many of whom are World of Hyatt members, since the resort is fully bookable on Hyatt points — can spend time relaxing by one of the tiered infinity pools or under the overwater cabanas, soaking in the spacious hot tub, luxuriating in the spa (pro tip: don’t miss the hammam), dining at the five gourmet restaurants or enjoying drinks at one of the many bars.
The 123 suites feature balconies or terraces (many with private tubs for either hot or cold soaking) as well as luxury perks like minibars, three-times-daily maid service, a welcome bottle of tequila, Le Labo bath amenities and chic, modern decor.
One of the major draws of the Impression brand is the Endless Privileges program, which includes unlimited food and drink (including top-shelf liquors) and 24-hour in-room dining service.

Reward your inbox with the TPG Daily newsletter
Join over 700,000 readers for breaking news, in-depth guides and exclusive deals from TPG’s experts
But perhaps the creme de la creme of luxury offerings is the personal butler service, available at guests’ beck and call from 7 a.m. to 11 p.m.
Rates at Impression Isla Mujeres by Secrets start at $1,500 or 50,000 World of Hyatt points per night for two guests.
Twin Farms
Steeped in history, Twin Farms was originally conceived by Nobel Prize-winning author Sinclair Lewis, who bought the farm for $10,000 in 1928 as a gift for his soon-to-be wife Dorothy Thompson (who asked for a Vermont farmhouse as her condition for marriage).
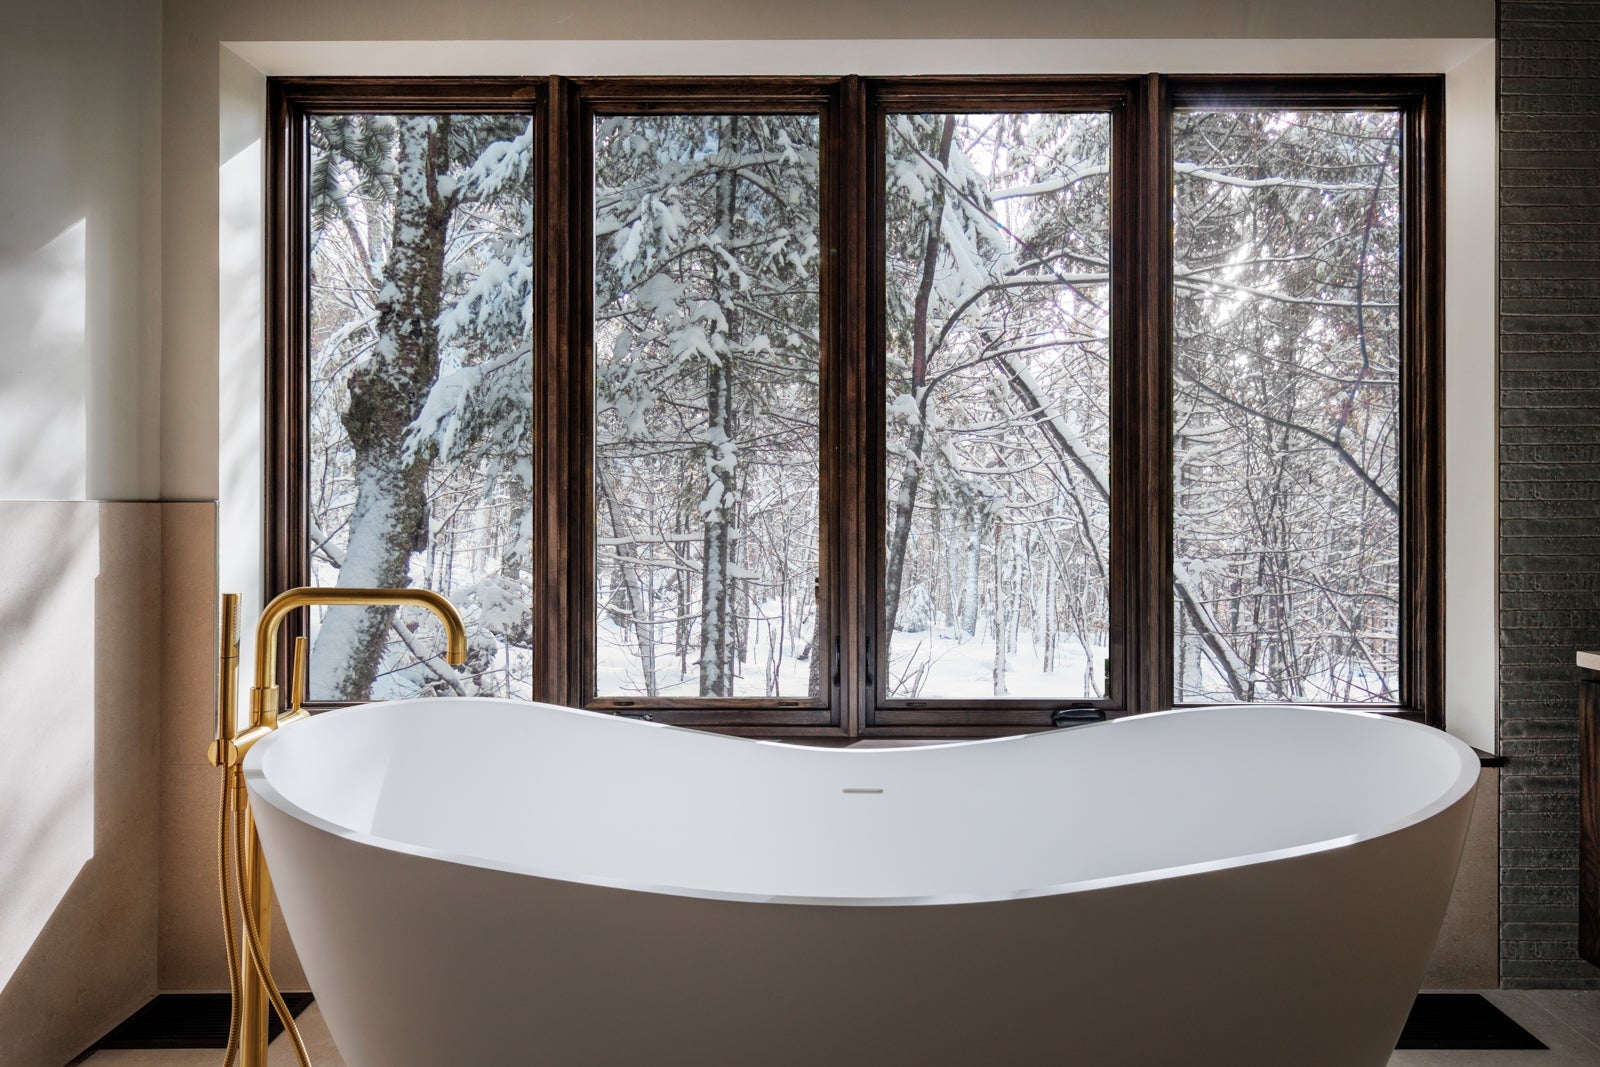
Now, this much-lauded, all-inclusive Relais & Chateaux property in Barnard, Vermont — a small town 30 minutes from Burlington — comprises a supremely elegant collection of 28 accommodations. The room options include free-standing cottages, treehouses and log cabins constructed from cedar, hand-hewn hickory, stone and glass. They are scattered across a bucolic 300-acre estate that has preserved the original farmhouse (dating to 1795).
Eminent interior designer Jed Johnson designed the original 15 individually styled accommodations. Striking and inviting in equal measure, these spaces — plus more added later — are a design-lover’s dream, with plush sofas, fireplaces and large free-standing tubs. The walls are graced by a superb collection of paintings, including masterworks by David Hockney and Jasper Johns, among other art world luminaries.
In the warmer months, room rates include activities such as tennis, fly-fishing, archery, kayaking, paddleboarding, nature walks and picnics in the woods. When it’s cold outside, you can venture out skiing or snowshoeing on the private mountain before returning home to luxuriate in a wooden Japanese onsen bath and cozy up fireside with steaming mugs of hot chocolate.
Regardless of what time of year you visit, you’ll indulge in gourmet, farm-to-table fare for all meals, and you can opt for the recently reintroduced Chef’s Table experience with a multicourse tasting menu. Expect nights filled with canapes and Champagne, as well as dishes that showcase ingredients sourced from the property’s gardens, trees and beehives.
All-inclusive rates at Twin Farms start at $2,950 per night, based on double occupancy. Keep in mind that “adults-only” here means children who are at least 14 years old are welcome.
Related: 5 incredible fall getaways in the Northeast
Green O at Paws Up
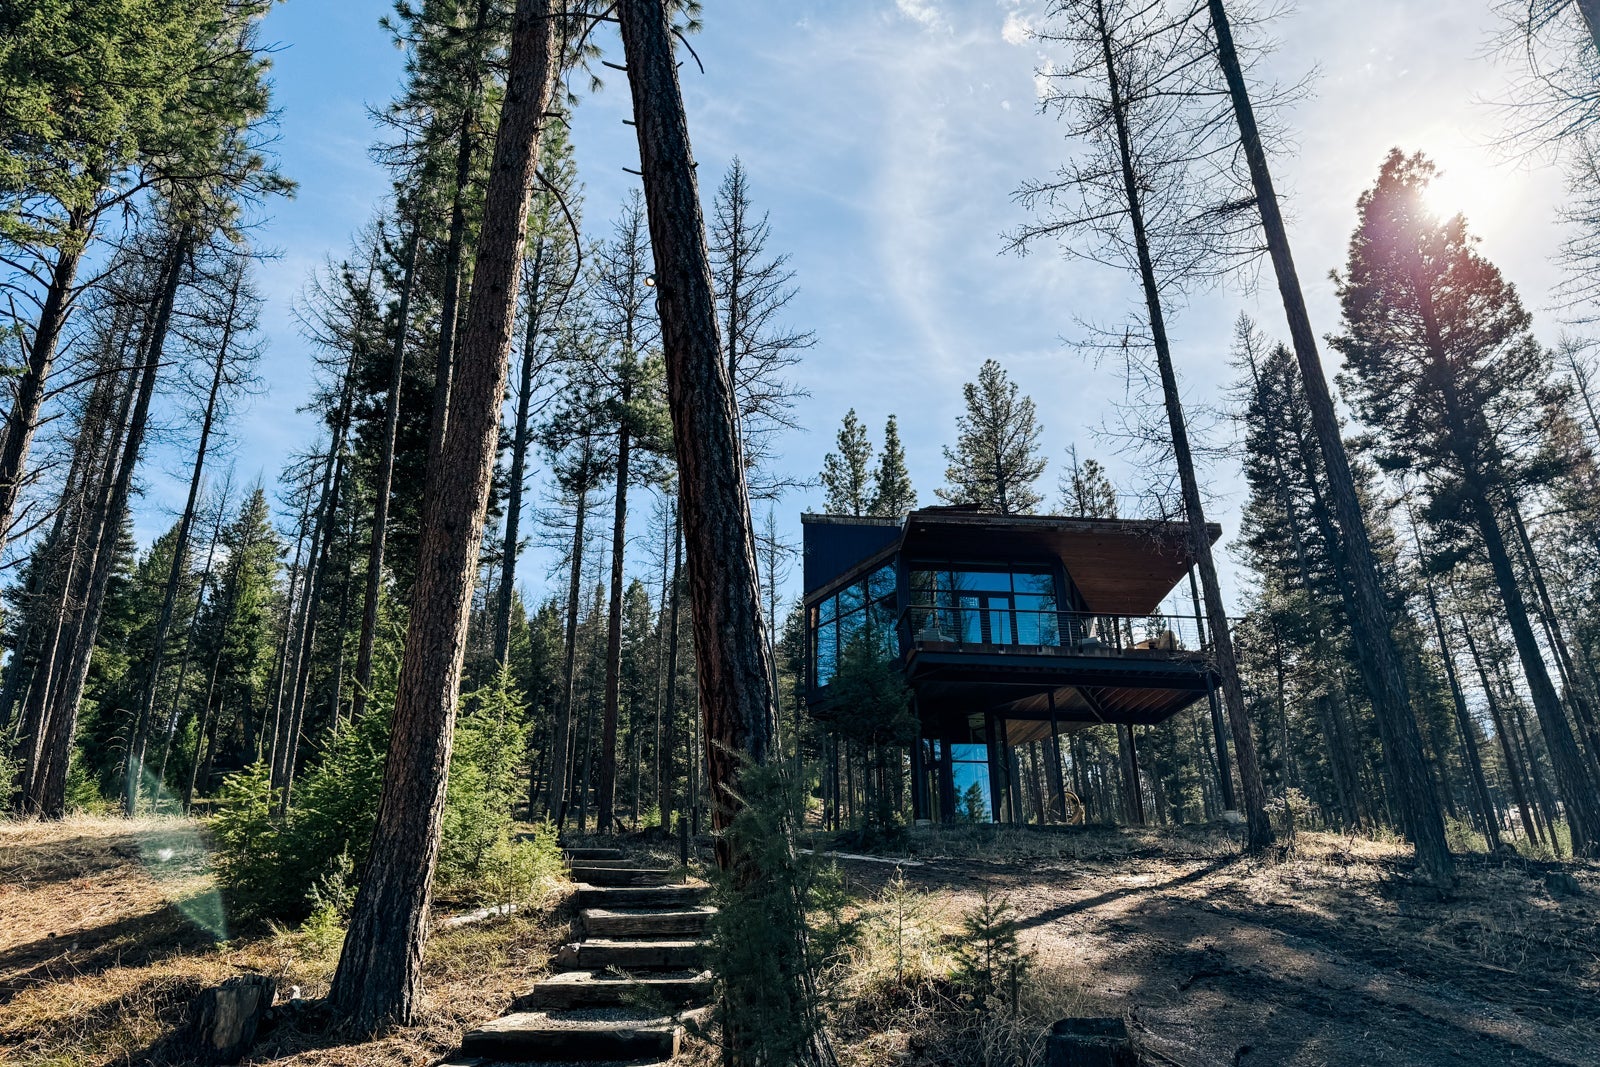
Surrounded by towering mountains, Green O at Paws Up is the adults-only property situated on the acclaimed Paws Up Montana. This architectural showstopper is a romantic haven for couples seeking a wilderness escape with a surfeit of outdoor adventures right on their doorstep.
About a 45-minute drive from the Missoula Montana Airport (MSO), Green O at Paws Up is home to 12 beautifully appointed, hygge-style accommodations that are scattered through northwestern Montana’s primordial forests. With the Bob Marshall Wilderness Complex to the north and the wildlife-filled Swan and Garnet mountain ranges nearby, it’s an awe-inspiring base from which to experience Montana’s wilderness scenery.
Accommodations come in four different “haus” designs with at least 880 square feet. Each is a luxurious, supremely comfortable riff on a Scandinavian cabin — with traditional Western touches — and embraces an inside-outside flow. There are light wood floors and ceilings, glass-walled living spaces with cozy fireplaces, white walls decorated with paintings, cushy sofas and armchairs, king-size beds, and large furnished outdoor spaces with hot tubs and swing chairs.
Guests have access to the (mostly included) excursions and activities available at Paws Up Montana, but the main draw of staying here is the horseback riding. Paws Up’s stables are among the largest in the state, and everyone from city slickers to seasoned equestrians can join all-day trail rides, arena lessons and cattle drives. Shooting, fly-fishing, hiking and fat biking are warm-weather options as well, while those visiting in winter can try snowsports galore, including snowshoeing, dogsledding and cross-country skiing.
Gourmet meals, which are included in the nightly rate, are served at the Social Haus. Menus showcase grilled meats raised on the ranch, as well as locally grown vegetables and fruits.
All-inclusive rates at Green O at Paws Up start at $3,151 per night, based on double occupancy.
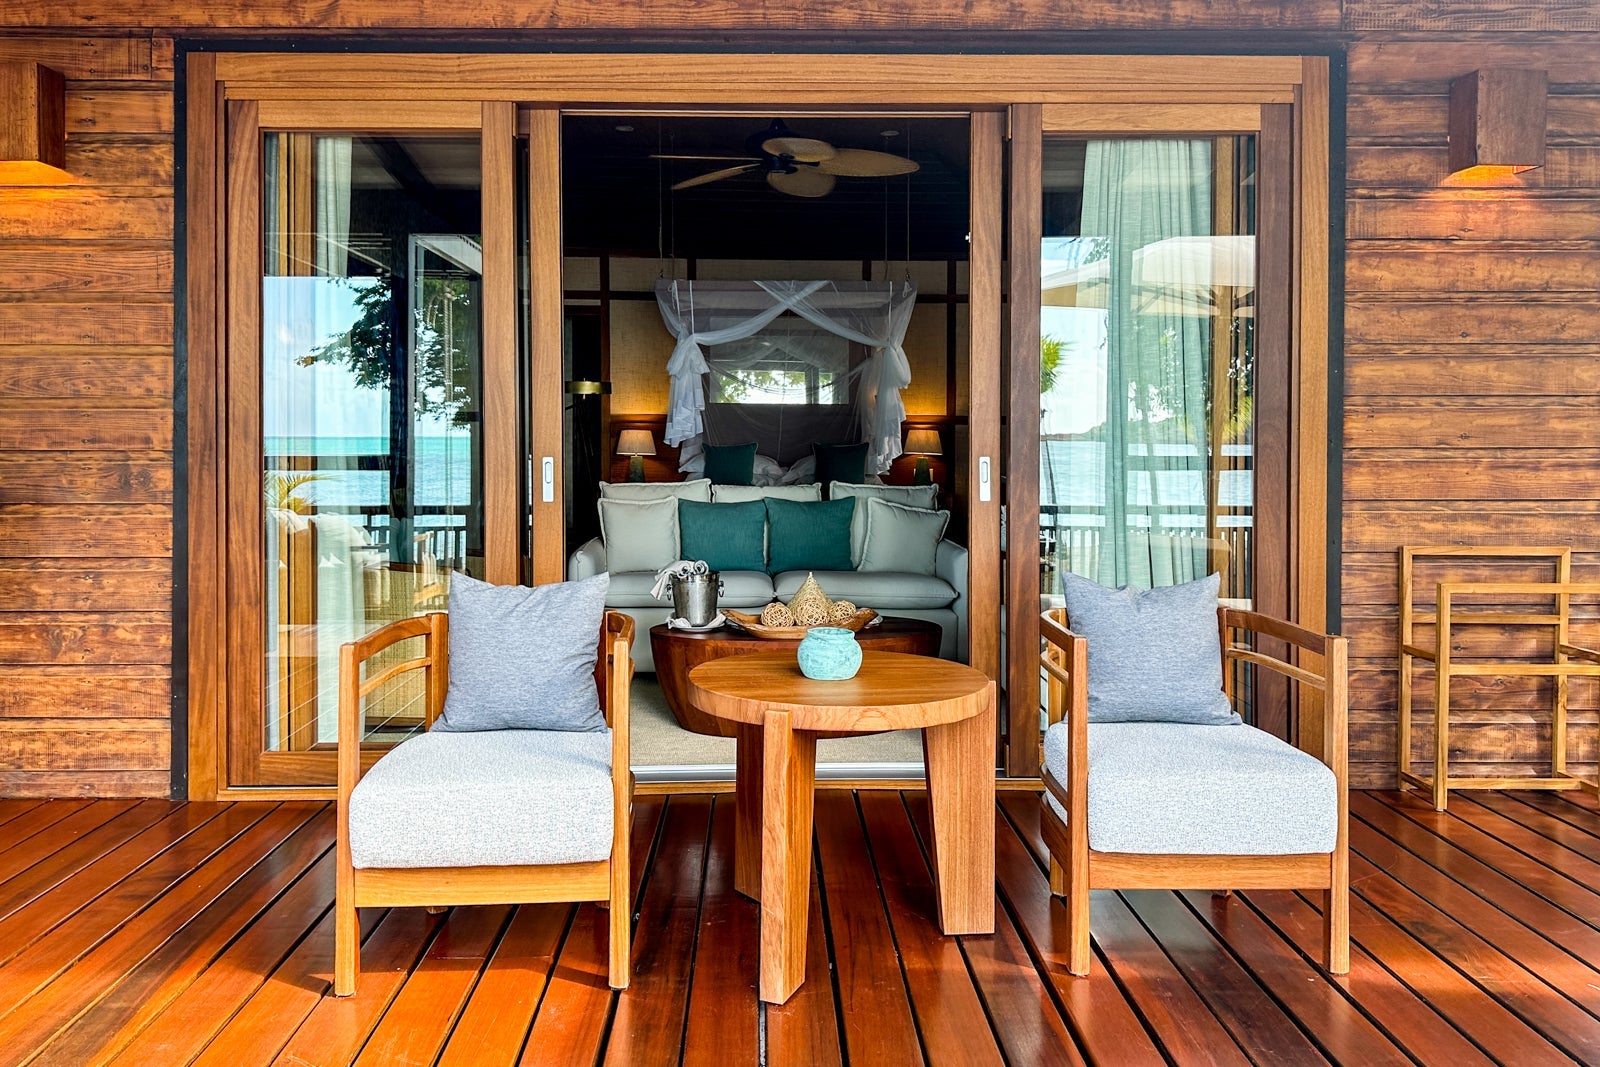
Likuliku Lagoon Resort
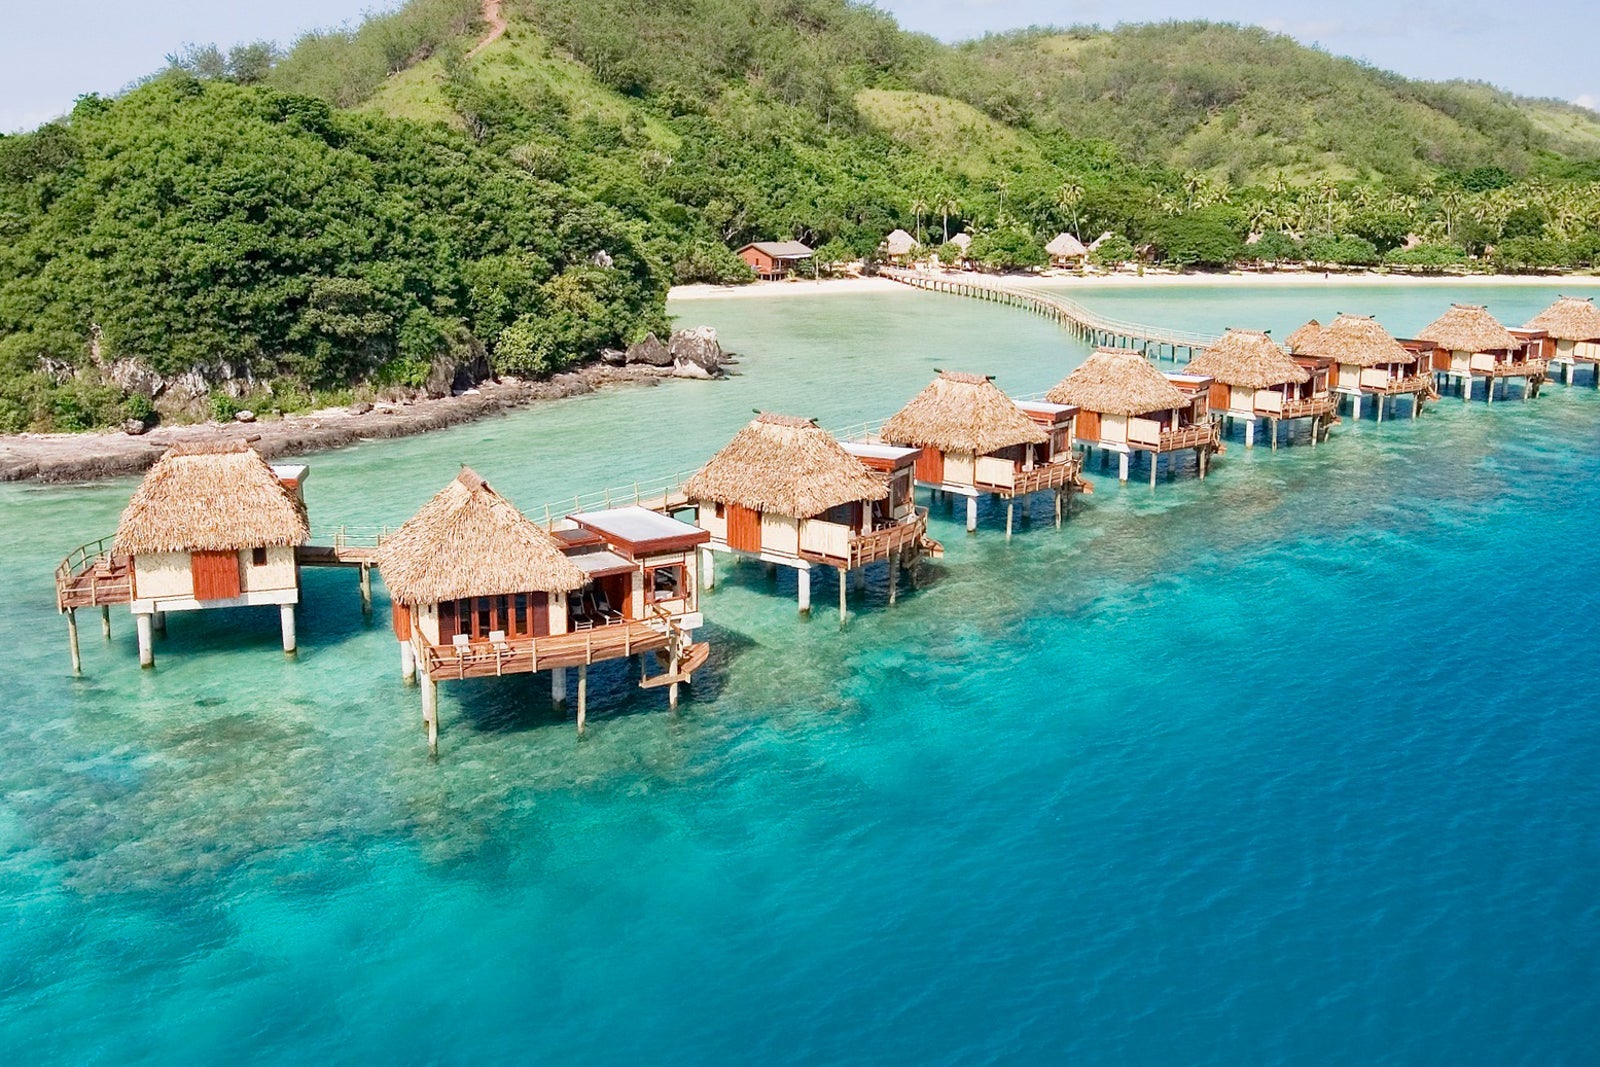
On the pristine white sands of Malolo Island, surrounded by abundant marine life, Likuliku Lagoon Resort is the quintessential South Pacific island paradise — and after a 2025 renovation, it is looking fresher than ever.
With a thatched design that takes its cues from traditional Fijian architecture, the entire resort feels completely in harmony with its natural setting. Its sustainability credentials are also strong, with initiatives including conservation of local flora and fauna, elimination of single-use plastics, eco-friendly cleaning products, water desalination, and recycling.
There are 17 secluded beachfront bures (thatched bungalows), as well as 29 deluxe beachfront bures with private plunge pools and indoor-outdoor showers. But for romantics and bucket-list travelers, the main draw at Likuliku is the 10 luxurious overwater bures (the only traditional ones in Fiji) with glass floor panels, instant ladder access to the lagoon, and a tropical-chic aesthetic that incorporates exotic furnishings, polished wooden floors, and locally inspired textures and fabrics. The design ensures that you can revel in those castaway dreamscapes from pretty much any vantage point — be it your furnished outdoor pavilion, your perfectly positioned deep-soaking bathtub or your plush daybed. Thoughtful, complimentary amenities include a pillow menu, binoculars, a complimentary sarong, and a canape plate and freshly baked cookies delivered to your room daily.
At the center of the resort, the infinity-edge outdoor pool is surrounded by plush loungers, and the heavenly spa incorporates Pure Fiji products in its extensive lineup of treatments, massages and therapies. For active couples looking to interact more with the landscape, there are jungle hikes, island-hopping tours and snorkeling excursions; Fiji’s waters are home to more than 1,200 species of reef fish, as well as several species of turtles. Sightings of dugongs and humpback whales are also possible.
The intimate Fijiana Restaurant serves fresh gourmet cuisine that showcases regional ingredients, sustainable local seafood and traditional cooking techniques. Signature dishes include a local masala curry and a roasted snapper with chorizo, peas and black olive. The 2025 renovation also introduced Saluwaki, the resort’s second dining concept. It offers Fijian-inspired Asian tapas, such as ember-roasted walu served with handmade squid ink noodles. All meals are included in the daily rate, but note that both alcoholic and nonalcoholic drinks cost extra.
Don’t miss a visit to the newly introduced Na Vanua Conservation Hub, an interactive area where guests can learn more about the resort’s environmental and community initiatives, including ongoing efforts around mangrove reforestation, coral planting, and behind-the-scenes recycling programs.
All-inclusive rates (based on double occupancy) at Likuliku Lagoon Resort in a beachfront bure start at $1,302 per night. In an overwater bungalow, rates start at $1,939 per night.
Sanctuary Cap Cana
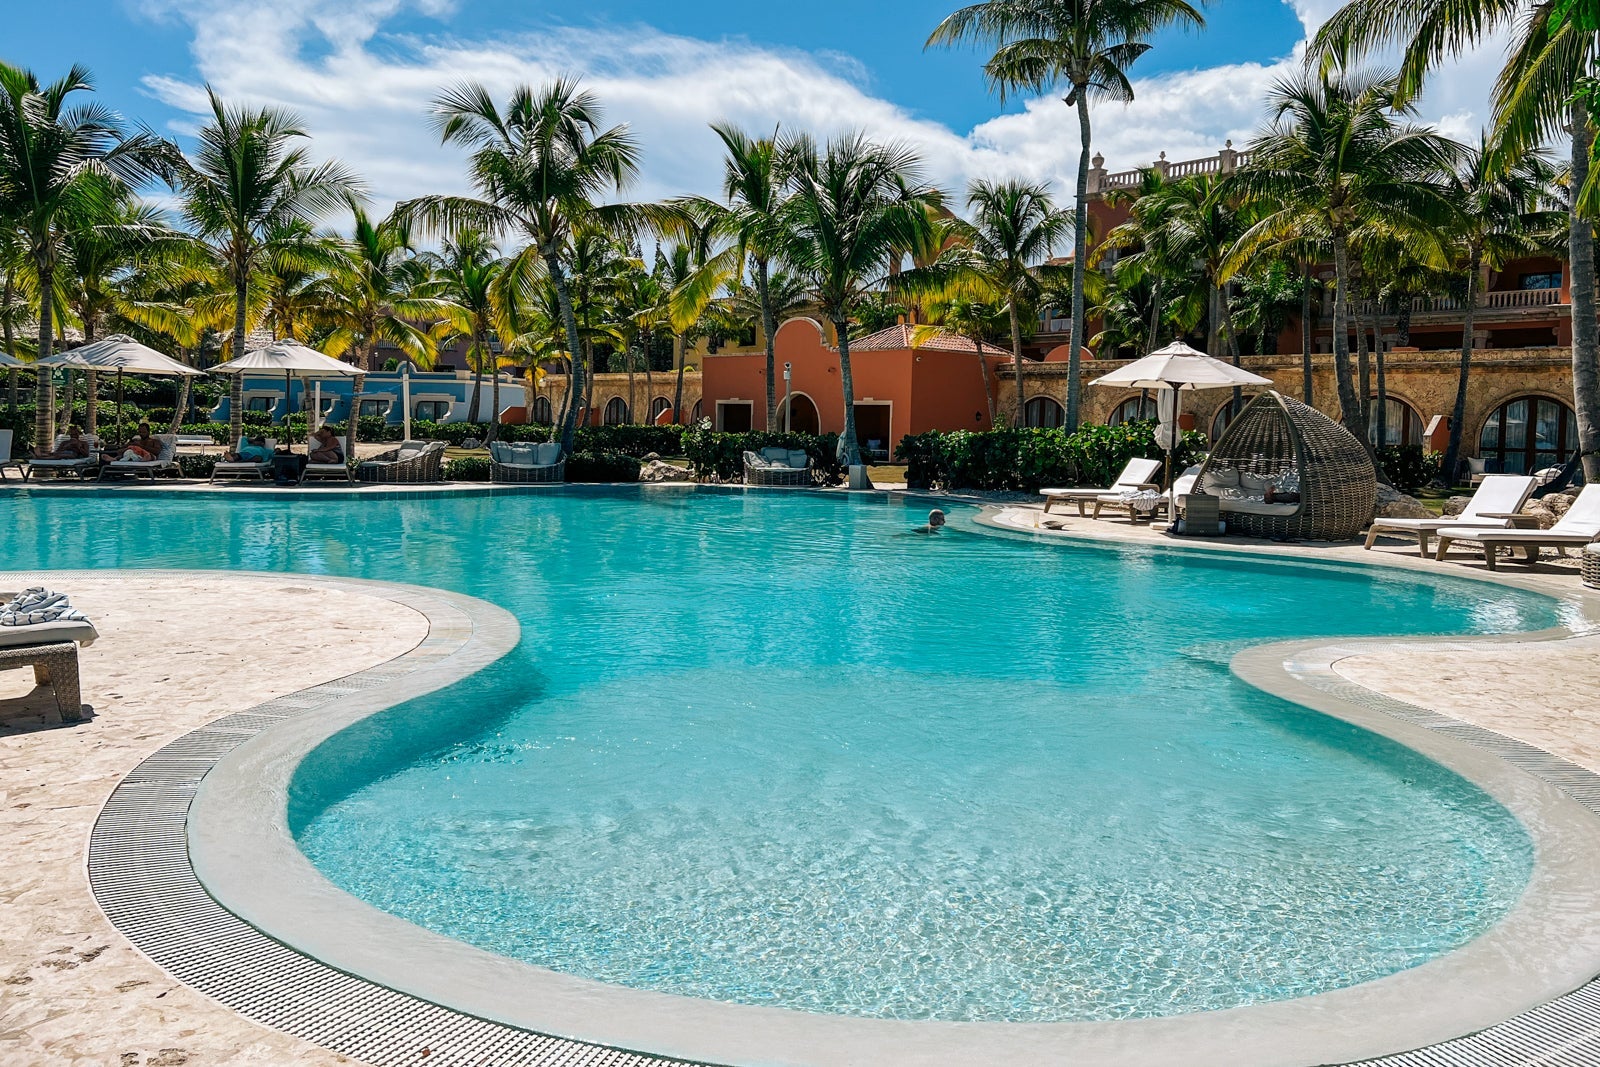
Part of Marriott’s Luxury Collection portfolio, the luxe 324-key Sanctuary Cap Cana overlooks a beautiful stretch of coastline within a gated enclave just 15 minutes from Punta Cana International Airport (PUJ).
With its distinctive Spanish castle design and buildings divided into sections, including the more exclusive “Castle” section (which comes with VIP services and private butlers), the rambling property wows with its art-filled public spaces, modern furnishings and soaring ceilings.
Rooms and villas span 19 different categories, including swim-up rooms and penthouse suites, so there’s something for every type of traveler. Thoughtfully appointed junior suites, which start at 646 square feet, sport a classic beach aesthetic with a serene white-and-cream color scheme contrasted by bold blue walls; layered textures and decorative elements like woven throws, rattan furnishings and gilded light fixtures top off the design.
Dining options include buffet fare at Casa Bella, seafood specialties at Blue Marlin, pan-Asian cuisine and omakase at Wok, and classic Italian at Capriccio. And there’s no shortage of inviting places to enjoy signature cocktails — whether it’s swimming up to Freshco Bar at the main pool or grabbing a predinner aperitif at Love Bar, a piano bar in the main lobby.
With six swimming pools, there’s always space to relax on a cushioned lounger and enjoy the ocean views. Active travelers can tee off at the Jack Nicklaus–designed Punta Espada Golf Club nearby, join a tennis clinic, take a dance class or play a game of beach volleyball. Within striking distance of the property, guests can zip line, hike and horseback ride.
The Sanctuary Spa offers a full menu of massages (starting at $165 for 50 minutes), as well as body treatments, facials, wellness journeys and mind-body classes, including yoga and meditation.
Rates at Sanctuary Cap Cana start at $456 per night but can soar to over $1,000 per night in the winter, or 120,000 Marriott Bonvoy points.
Hyatt Zilara Cap Cana
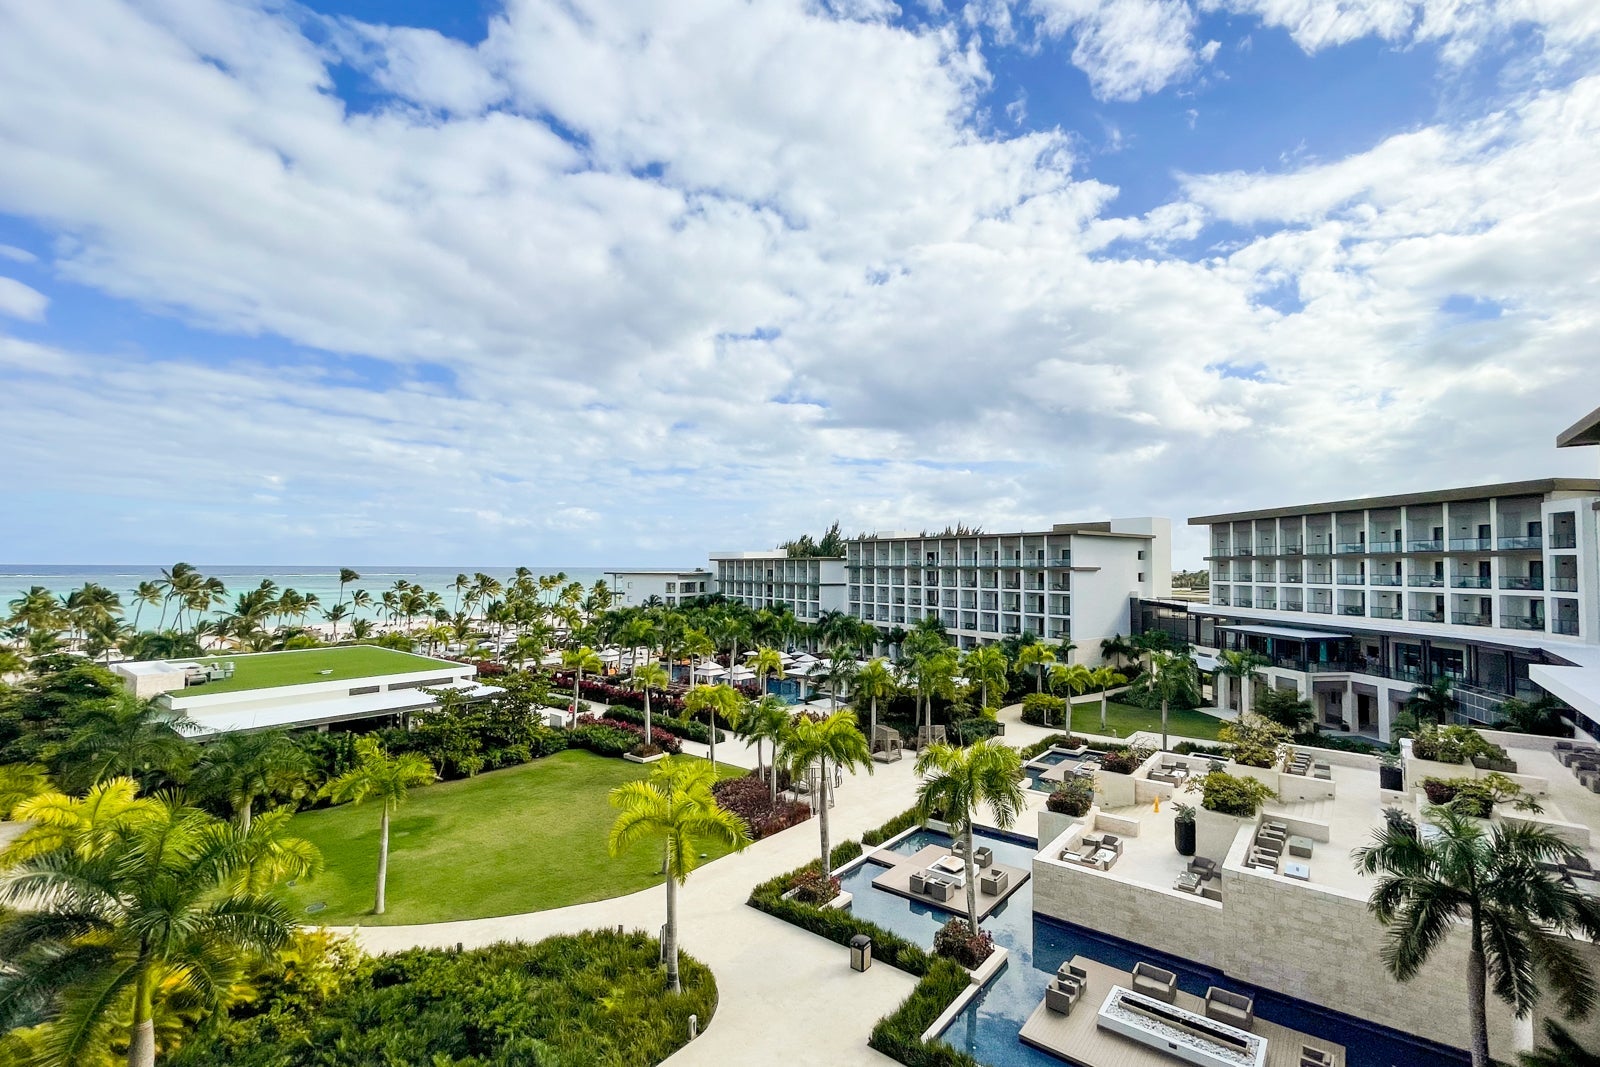
Near palm-fringed Juanillo Beach, the adults-only Hyatt Zilara shares the luxe, gated Cap Cana complex with its family-friendly counterpart, the Hyatt Ziva Cap Cana. Just 15 minutes away from Punta Cana International Airport (PUJ), this attractive, manicured resort marries convenience and abundance with a picture-perfect location.
At the Hyatt Zilara, there are 375 suites with about 600 square feet of space. Myriad accommodation types meet every mood and budget, including swim-up suites, oceanfront suites and club-level suites that include extra perks and amenities, such as an exclusive lounge, premium liquors and personalized concierge service.
A contemporary, streamlined style prevails in all guest rooms. Expect neutral hues and simple furnishings with occasional tropical bursts of color in accents like woven headboards and mosaic bathroom tiles.
Amenity highlights include several infinity-edge pools, a lazy river, a luxurious spa designed to resemble a cenote and a plethora of restaurants, some of which the resort shares with its sister property. Culinary standouts include the steakhouse Waves, French-Polynesian restaurant Brando’s and breezy oceanfront Caribbean fusion restaurant Shutters Beachside, which serves fresh seafood and ceviche.
With lively pool parties, yoga classes, water aerobics, nonmotorized water sports and nightly entertainment in the outdoor amphitheater, the action here is nonstop. Adults can toggle between the Zilara and the Ziva; the latter has a slew of family-oriented amenities for those young at heart, including its centerpiece Canapolis Waterpark.
All-inclusive rates for the Hyatt Zilara Cap Cana start at $539 or 21,000 World of Hyatt points per night, based on double occupancy.
Related: 7 things to know before booking a stay at the Hyatt Zilara Cap Cana
Hermitage Bay
Down a long, unpaved road on a quiet stretch of Antigua’s west coast, Hermitage Bay peeks out of the forest and reveals itself cinematically. It’s set around its own secluded cove, where calm, turquoise waters are inviting at all hours of the day.
Originally opened in 2006 and carefully built to have minimal impact on its natural surroundings, this resort prioritized sustainability before sustainability was trendy. Now, the property is part of the Small Luxury Hotels of the World portfolio, and thanks to a recent renovation completed, it feels more relevant than ever. (Bonus: Thanks to SLH’s partnership with Hilton, you can book using Hilton Honors points.
There are just 30 stand-alone suites with sun-filled interiors and lots of white linens and rattan furniture, letting the lush landscape take center stage. Outdoor space is a focus too: Suites have expansive decks outfitted with daybeds, lounge chairs and private plunge pools, as well as open-air showers.
Dining is centered around a single restaurant, but its rotating, seasonal menu keeps things interesting. The menu draws on local seafood and produce (much of which is sourced from an on-site garden), and dishes range from Caribbean curries and grilled fare to international offerings.
Wellness is a focus, too, with complimentary yoga, meditation or Pilates sessions in the mornings. Plus, the fantastic massage team offers treatments in both the spa and the privacy of your room.
The service is warm and personal. Hermitage Bay has staff members who remember names and preferences and make every guest feel like a VIP. If ever there was an all-inclusive property that might change your mind about how delicious, luxurious and personal an all-inclusive can feel, this is the one.
All-inclusive rates at Hermitage Bay start at about $1,875 or 230,000 Hilton Honors points based on double occupancy.
Hurawalhi Island Resort
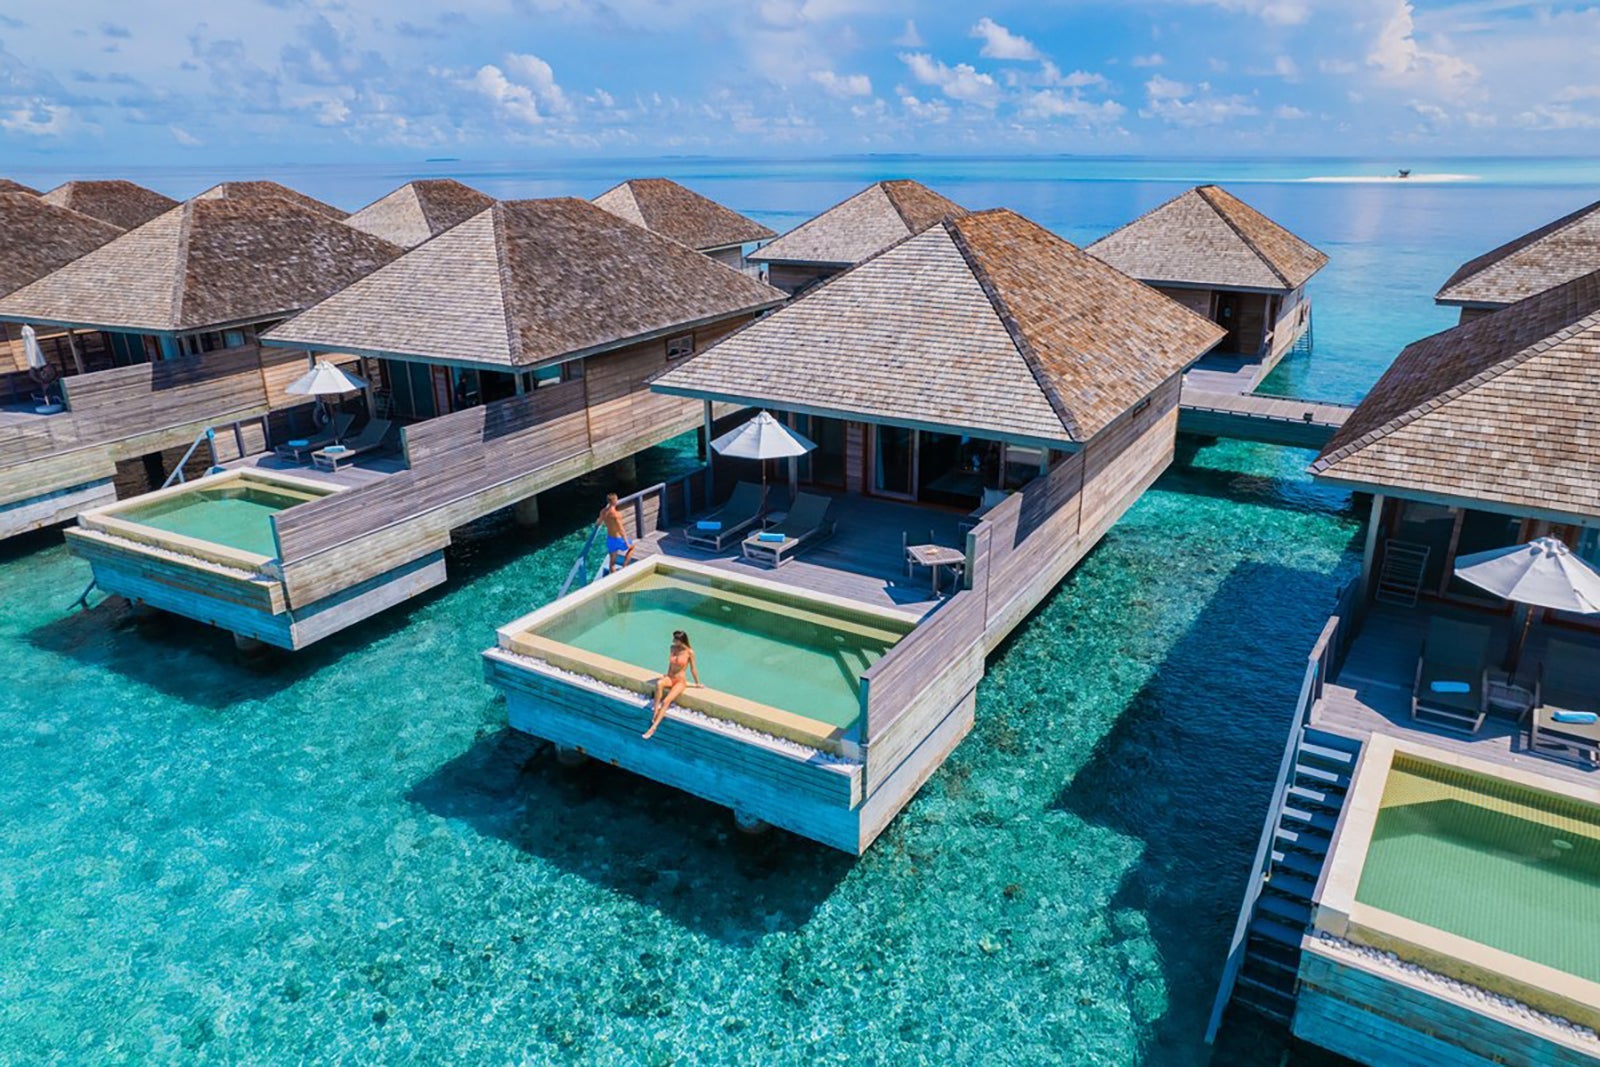
In the heavenly Lhaviyani Atoll, the 90-villa Hurawalhi Island Resort is the quintessential honeymoon destination, combining blissful scenery, barefoot-chic vibes and luxurious overwater bungalows with contemporary amenities.
Upgraded beachside villas are huge (measuring about 1,130 square feet) and lavishly appointed with exotic hardwood furnishings, glass-walled bathrooms and large furnished terraces with a private pool. But you’ve come this far and dreamed this big, so live the Maldivian fantasy with one of the luxurious overwater bungalows; they have the same design as the beachside villas, plus steps leading down into the crystal-clear waters of the lagoon.
When it comes to dining, the all-inclusive package covers all meals at Canneli, which serves buffet-style international fare. However, there are additional restaurants you can pay to dine at. Kashibo is an Asian-fusion restaurant known for its inventive mixology; definitely try a Thai sabai made with Cuban rum, ginger, cucumber, cardamom and passion fruit. Also, don’t miss 5.8 Undersea, where multicourse tasting menus (think: wagyu beef tenderloin, Patagonian toothfish and Canadian lobster) are served in the world’s largest all-glass, under-the-sea restaurant (19 feet below the surface).
Unsurprisingly, indulgence, relaxation and luxuriation with mesmerizing views of the atoll are what draw most guests here. Those in search of more adventure are in luck, as the resort has all kinds of nonmotorized water sports in addition to snorkeling excursions with manta rays (often in the company of the resident marine biologist) and dolphin “safaris.” On land, there are also tennis and badminton courts, and there’s a game room with air hockey, table tennis and arcade games.
All-inclusive rates at Hurawalhi Island Resort start at $1,250 per night, based on double occupancy.
Bungalows Key Largo
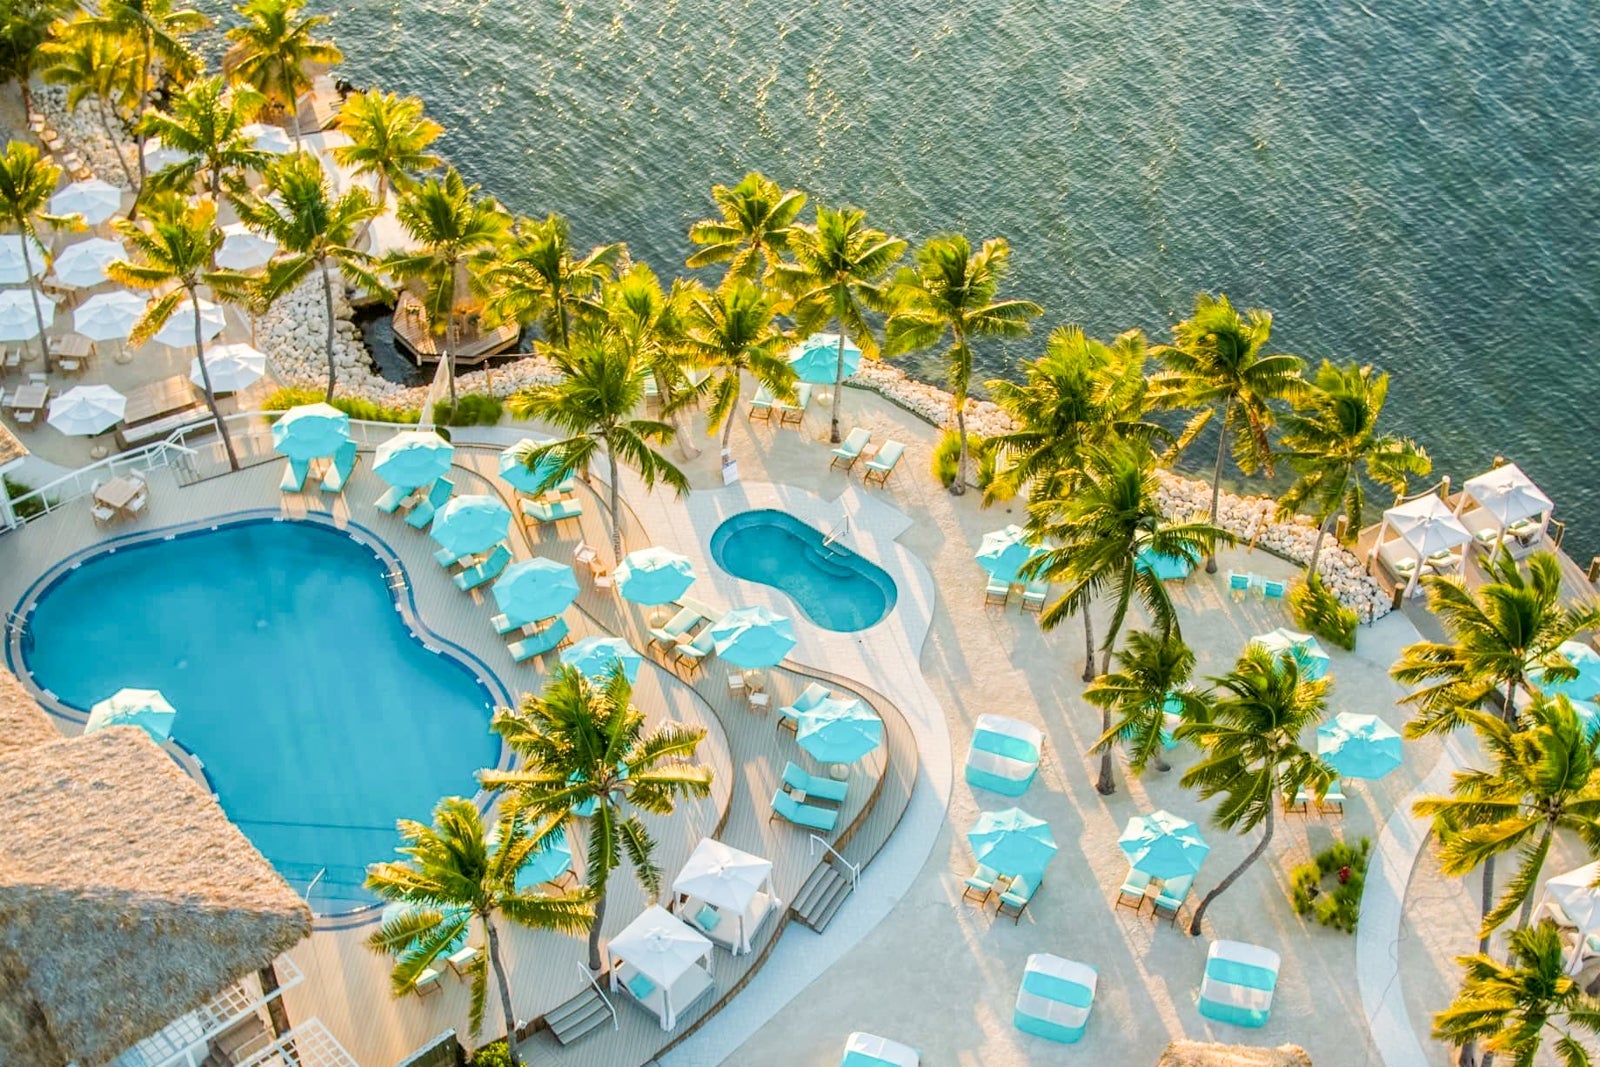
True all-inclusive resorts in Florida are hard to find, but this charming beachfront property, less than an hour’s drive from Miami International Airport (MIA), has plenty to offer couples looking for an upscale property in an idyllic location.
Expect inventive cuisine, top-shelf liquors and daily activities (yoga, paddleboarding and nightly entertainment like karaoke and trivia nights) — all included in the rate.
Chic and spacious garden-view or beachside bungalows make the case for blissful lounging. Furnished patios have outdoor rainfall showers, porches are decked out with Adirondack chairs — perfect for taking in the spectacular sunsets — and there are decadent deep soaking tubs in the polished bathrooms.
On-site restaurants and bars include piquant Mexican classics at the oceanfront Sea Senor, Italian with a seafood spin at Fish Tales and tropical libations at the swanky Hemingway Bar.
There’s a glistening pool surrounded by blue-cushioned loungers, a fitness tiki hut, a lively beach club and plenty of secluded nooks (where you can retreat with a craft cocktail in hand) to admire the far-reaching views.
Rates at Bungalows Key Largo start at $799 per night, based on double occupancy. Garden Bungalows have a two-night minimum stay while Waterfront Bungalows have a three-night minimum stay. (“Adult” here means anyone age 21 and over.)
Jade Mountain
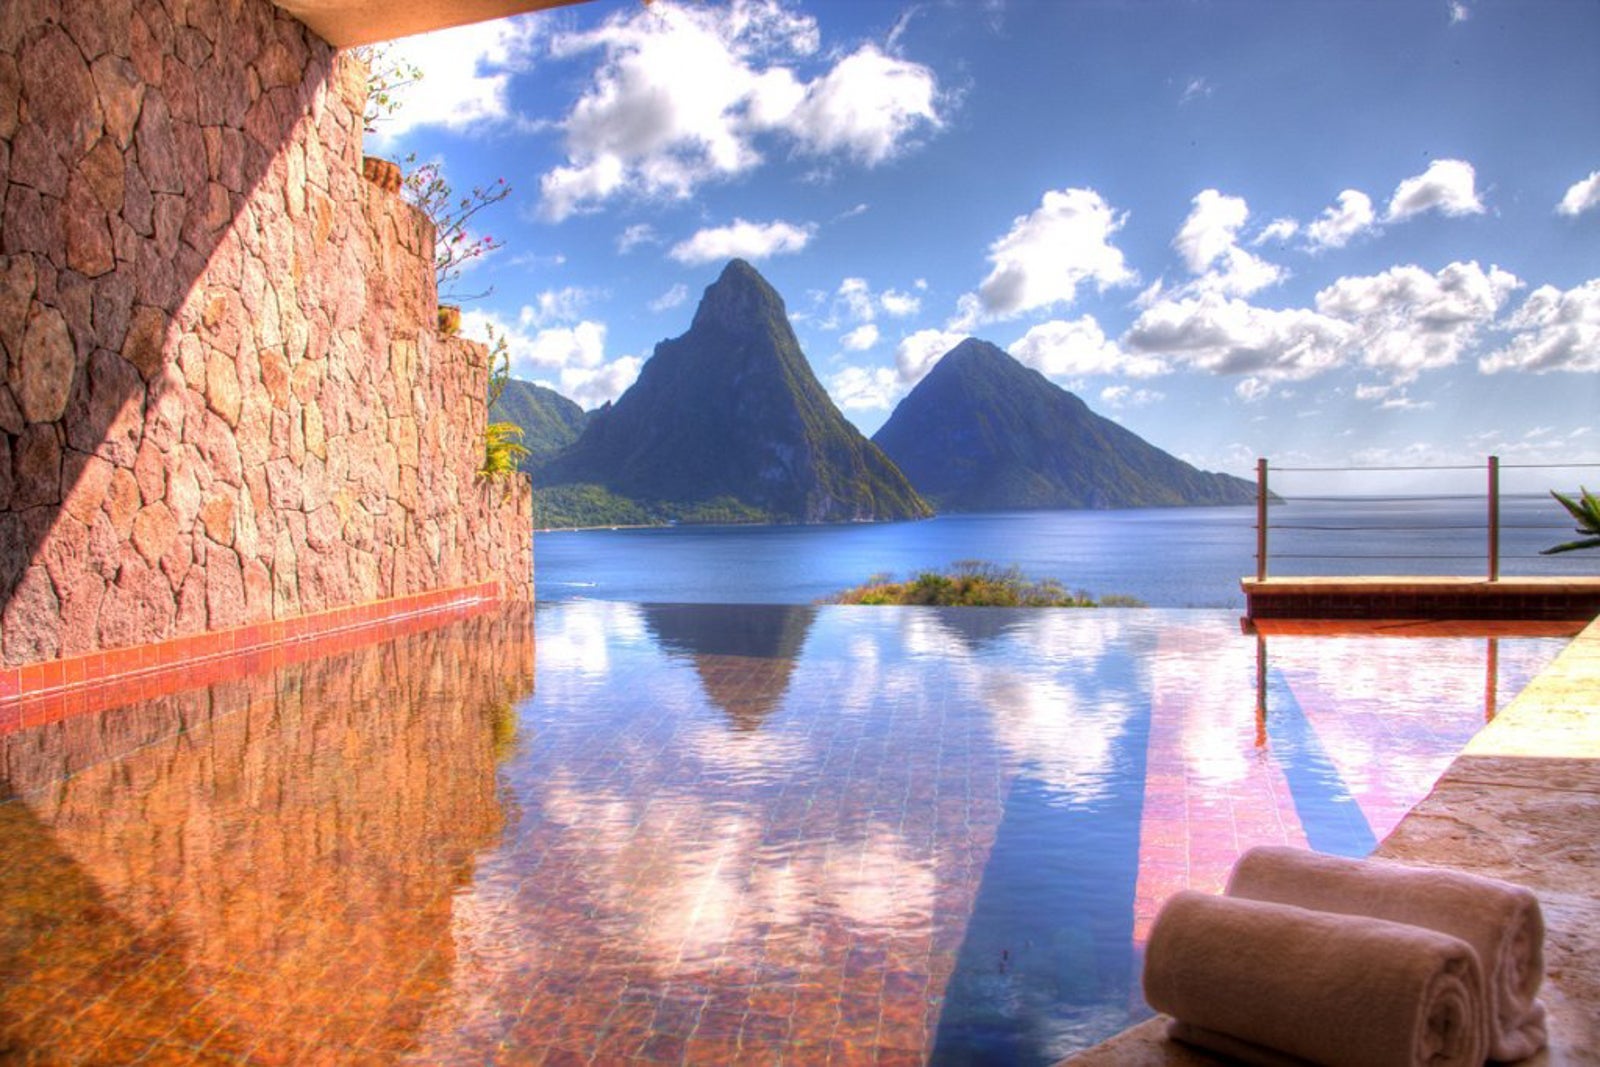
Few islands in the Caribbean are considered as romantic as St. Lucia, and one of its most romantic properties is undoubtedly Jade Mountain. Just a 12-minute drive from Soufriere, this all-inclusive resort is an exclusive hideaway for couples, carved into a mountainside overlooking a gorgeous bay with golden sands.
Whether you spend your stay sipping cocktails beneath star-studded skies on the Celestial Terrace or lounging on one of two beaches shared with its sister property, Anse Chastanet, everything about Jade Mountain is designed to immerse you in St. Lucia’s stunning coastline and dramatic UNESCO-inscribed Piton mountains.
You’ll find fantastic snorkeling and diving at the offshore reef, plus opportunities to dial up the romance during activities like sailing excursions on Miss Babsie (the house catamaran) and strolls through the on-site garden. There’s a spa, too, for those who wish to indulge in a treatment.
Aptly named “sanctuaries,” all 24 guest rooms are bigger than your average city apartment — starting at 1,400 square feet. They embrace an off-the-grid vibe, with no phones or TVs and an inside-outside design ethos. The decor is tropical-chic, with wicker and rattan furnishings, wooden floors and exotic motifs in a neutral color scheme with exuberant pops of green, blue and pink.
There are five room categories to choose from, all named after natural phenomena. Every room has a massive terrace and an open fourth wall to maximize those stellar Piton views; the Galaxy, Sun, Moon and Star sanctuaries also come with private infinity pools measuring between 450 and 900 square feet.
All meals are served in the resort’s restaurant, Jade Mountain Club. The dining venue specializes in inventive Caribbean fusion cuisine that incorporates local, tropical ingredients and reflects the culinary vision of James Beard Award-winning chef Allen Susser.
All-inclusive rates at Jade Mountain start at $1,575 per night, based on double occupancy. Keep in mind that this resort allows guests 15 and older.
Grand Velas Boutique Los Cabos
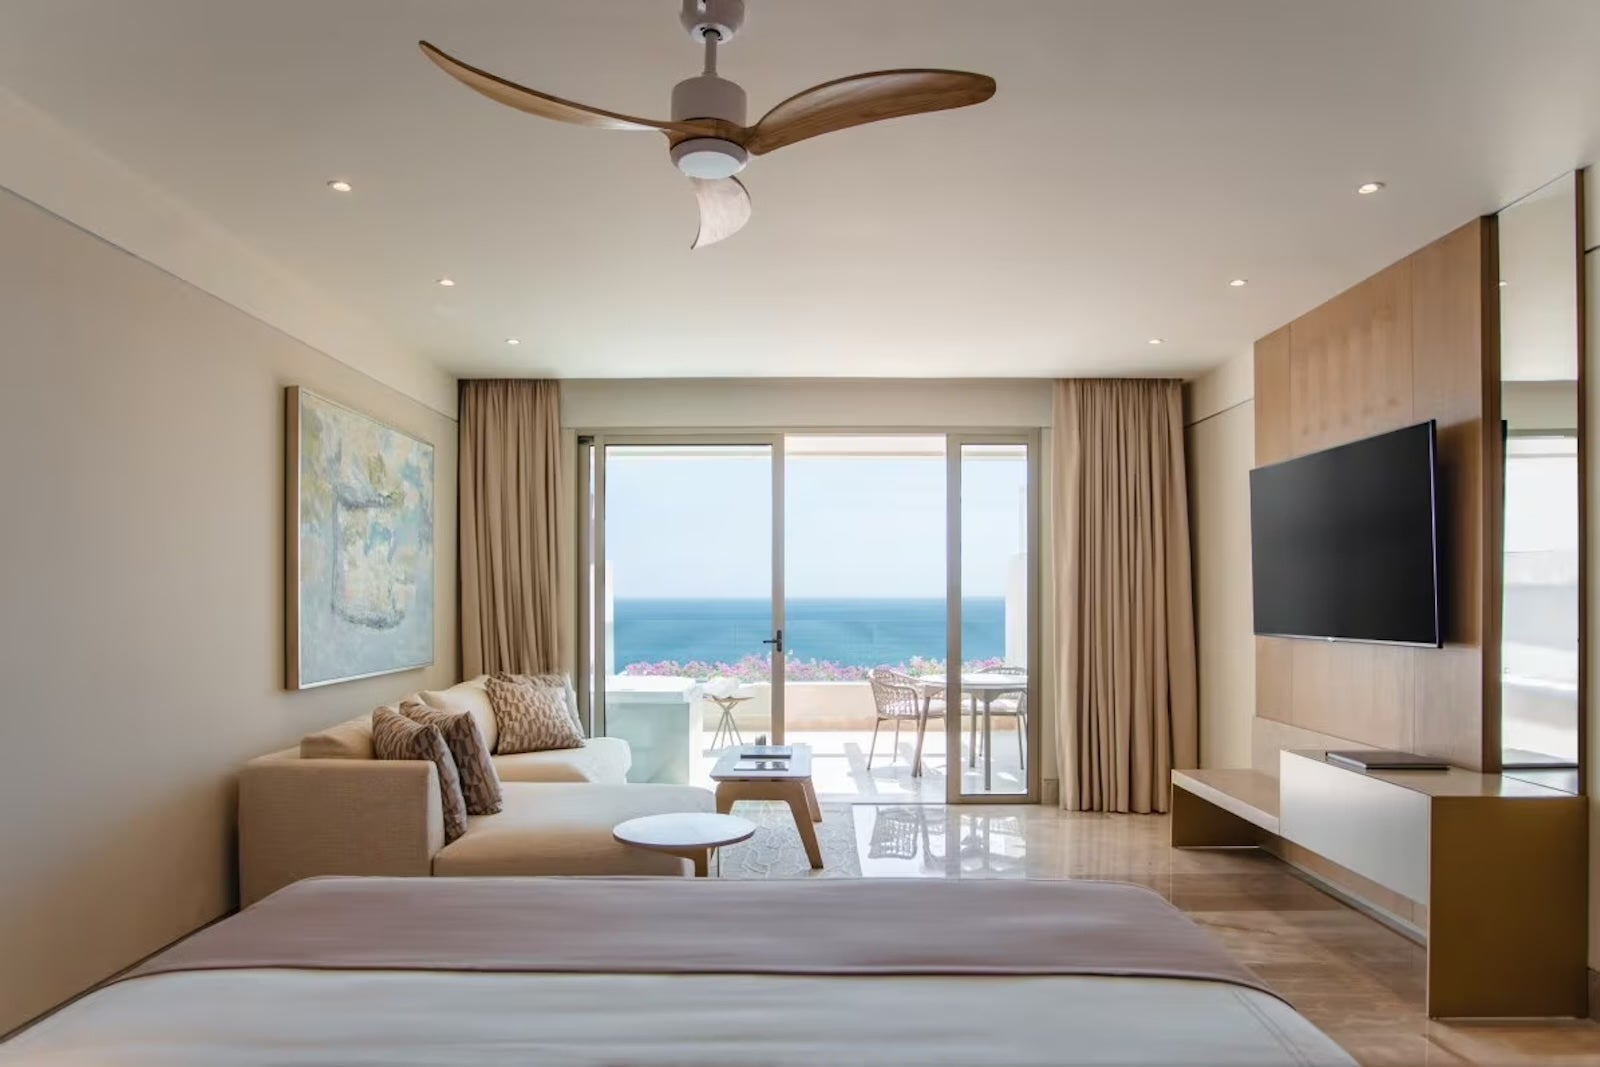
Grand Velas has a reputation as one of the most luxurious all-inclusive brands in Mexico’s competitive all-inclusive scene, and this adults-only addition, which opened in 2023, delivers on that promise. It’s adjacent to the larger Grand Velas Los Cabos, so guests can benefit from some of those larger-scale amenities (restaurants, pools) but retreat to their adults-only paradise when desired.
The all-suite resort has a noticeably calmer atmosphere than its neighbor. The design is clean and contemporary, and even entry-level suites clock in at around 1,000 square feet. Accommodations offer dreamy ocean views, large terraces outfitted with plunge pools and fire pits, and, of course, well-stocked minibars (which are included).
Bathrooms come with large soaking tubs, walk-in showers and high-end amenities like Molton Brown toiletries and showerheads that filter water and infuse it with Vitamin C for enhanced skin hydration and healthier hair during your stay.
Be sure to book some time at the SE Spa, too. While treatments are not included in your rate, they are well worth a splurge. Think hydrotherapy circuits, a magnesium pool experience, infrared detox therapy, guided meditations, and top-notch products from brands like EviDenS de Beaute and Natura Bisse. The signature “Sounds of the Ocean” treatment pairs a deeply relaxing massage with soothing sound bowl therapy, echoing the rhythms of the Pacific shoreline.
Grand Velas Boutique Hotel’s comparatively compact footprint makes it easy to navigate, with an impressive infinity pool at its center. On-site dining includes Loto Robata Grill, which offers Japanese-style grilled meats and seafood. The property also offers a great portfolio of experiences, such as chocolate and mezcal tastings — all included in the rate.
Rates at Grand Velas Boutique Hotel Los Cabos start around $1,200 per night, based on double occupancy.
Secrets Papagayo Costa Rica
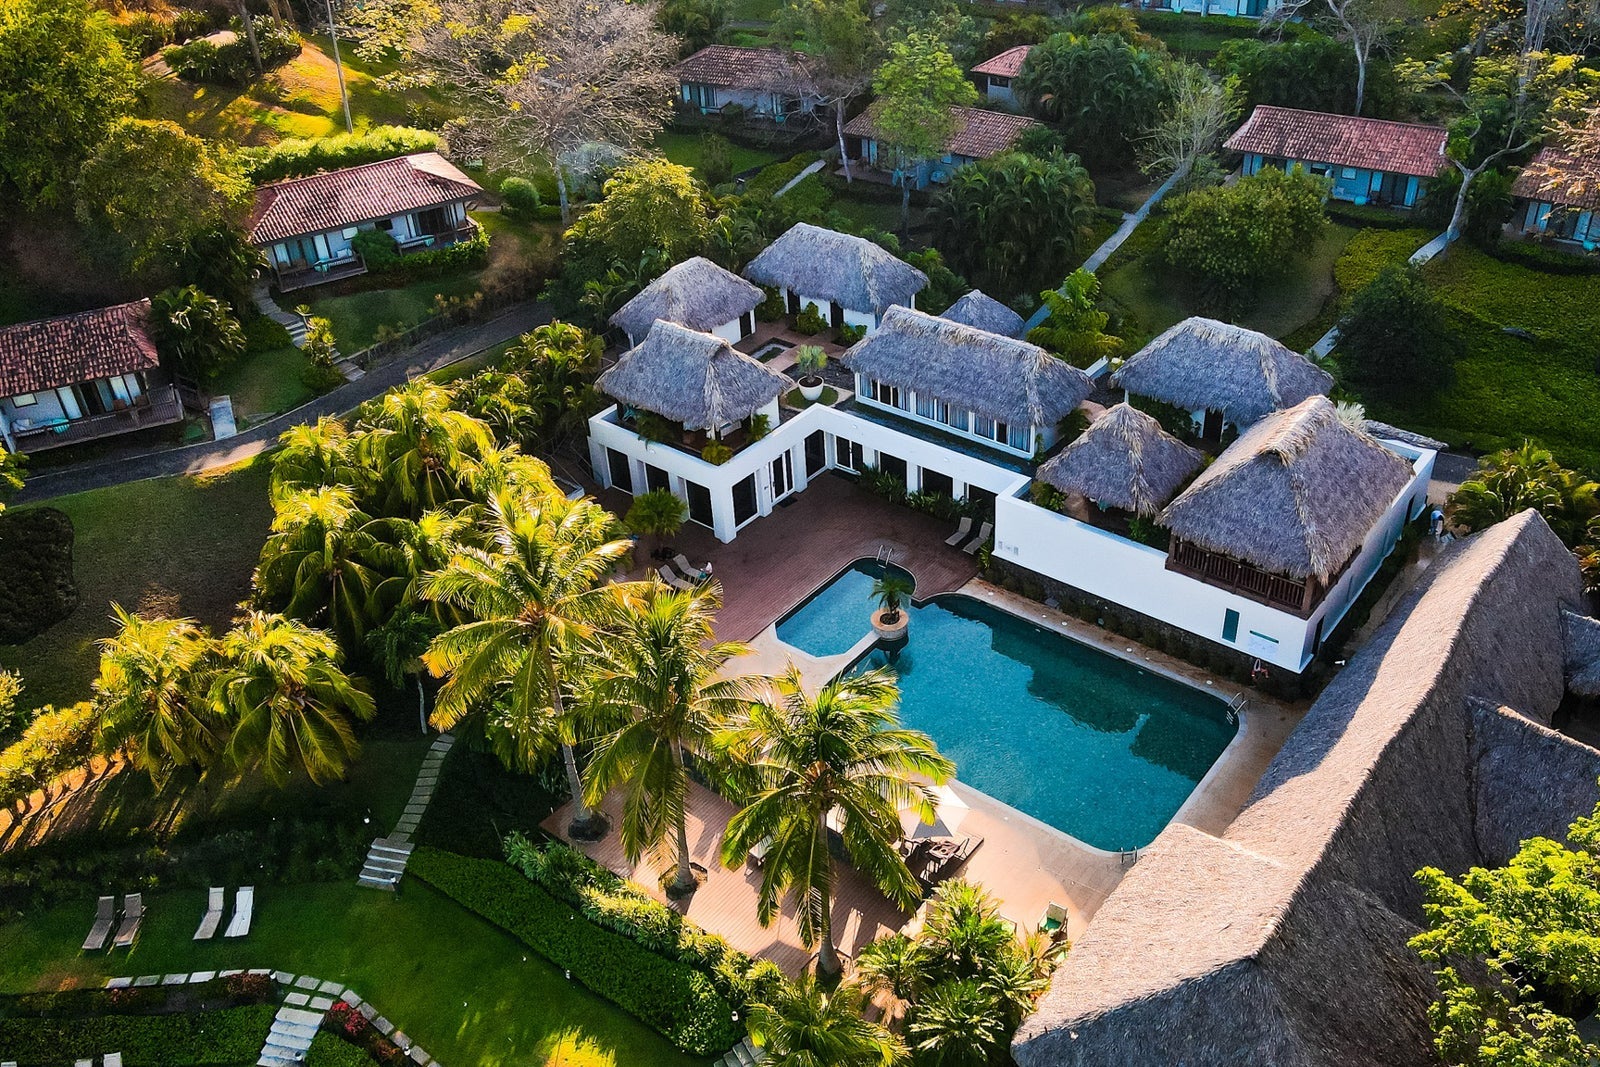
This polished 202-room property offers the perfect Costa Rica trifecta of beach, rainforest and wildlife. Part of the Hyatt portfolio, Secrets Papagayo Costa Rica sits less than 15 miles from Liberia International Airport (LIR) yet feels immersed in nature from its hillside perch overlooking Arenilla Beach.
At 398 square feet, standard rooms aren’t huge here, but they are contemporary and bright, with blond wood and wicker furnishings, plus balconies or terraces that have either garden or bay views. Contemporary bathrooms are well-designed with double sinks and walk-in showers. Upgrade to a club-level accommodation for access to the property’s Preferred Club, where continental breakfast, hors d’oeuvres, desserts and premium liquors are served daily.
When your stomach starts to growl, sit for a meal at one of seven dining venues. Crowd pleasers include Himitsu, a Pan-Asian restaurant, and Portofino, a romantic Italian eatery. For those who prefer a lot of options, make your way to the Market Cafe, a buffet-style establishment with an array of international dishes.
Amenities are plentiful, too. Two infinity-edge pools (one with a swim-up bar) are beautifully integrated with the beachfront setting and are surrounded by daybeds and loungers. The gym is well equipped with cardio machines and a separate weight room, and you can join any classes or activities that populate the daily calendar, including cooking classes, beach hikes, yoga sessions and coffee tastings. The resort can also arrange off-site deep-sea fishing, scuba diving and zip-lining excursions for a fee.
All-inclusive rates at Secrets Papagayo Costa Rica start at $370 or 25,000 World of Hyatt points per night, based on double occupancy.
Miraval Arizona Resort & Spa
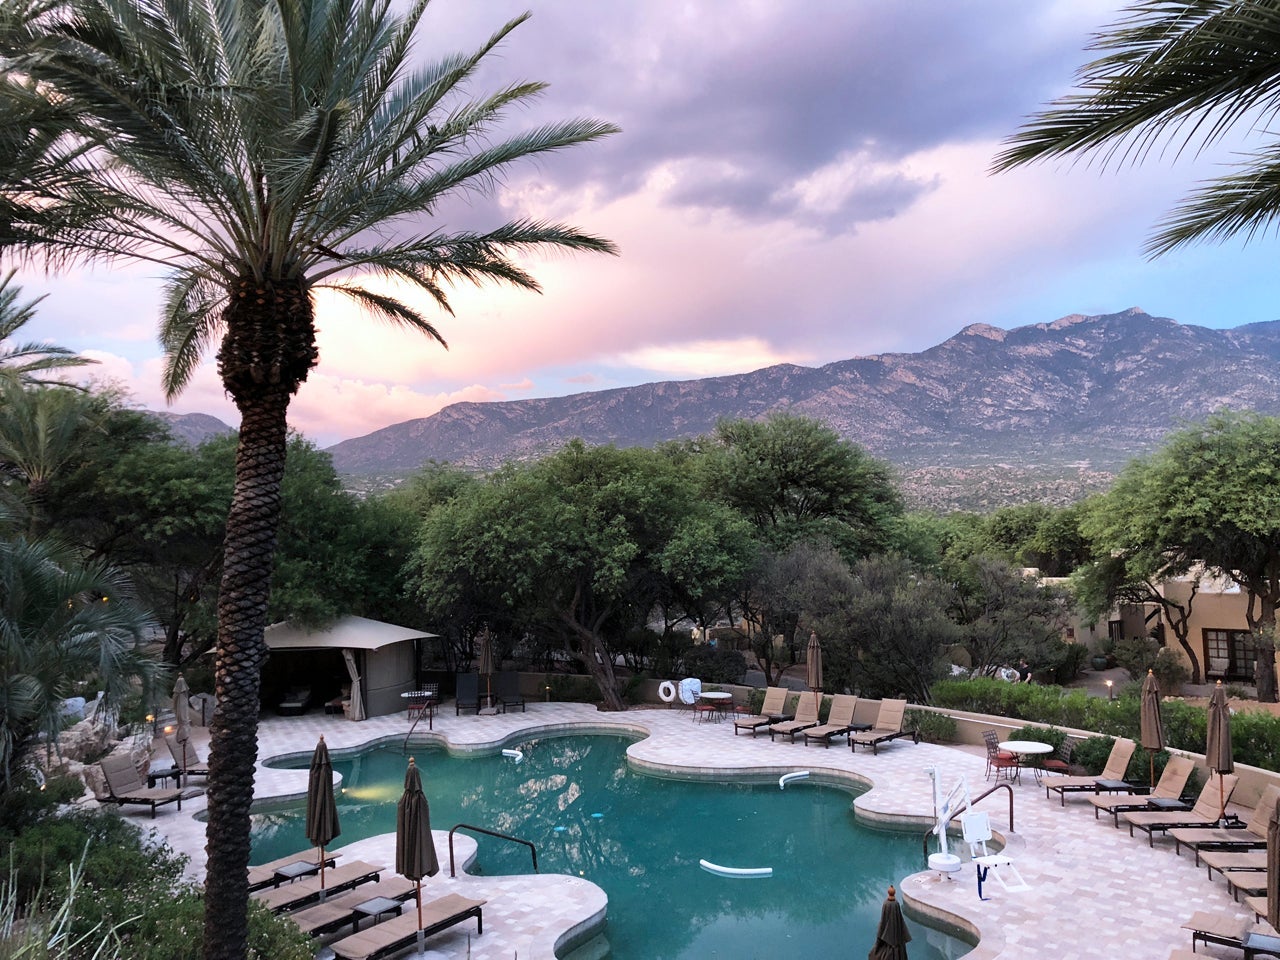
The Miraval brand is synonymous with rejuvenation, balance and a be-kind-to-yourself form of indulgence. An hour from Tucson International Airport (TUS), the Miraval Arizona Resort & Spa is all about embarking on a mental well-being journey, in Miraval speak. Guests come here to eat healthier, partake in an array of mind-body pursuits, push their wellness boundaries and eliminate any tech impulses. (Guests receive a cellphone “sleeping bag” at check-in to encourage disconnecting from their devices.)
As you’d expect, each of the 118 rooms, suites, villas and retreats is a calming, serene haven designed to blend harmoniously with the surrounding desert and mountain landscape. Starting at 400 square feet, rooms are appointed with contemporary furnishings in a muted color palette of brown, white and gray. The highlights, though, are the thoughtful relaxation-focused touches, such as Tibetan singing bowls, meditation cushions and Miraval’s super-comfortable “cloud” beds dressed in bespoke bedding.
Breakfast, lunch and dinner are served in the Cactus Flower Restaurant. Don’t expect it to be all panaceas and penance when it comes to the all-inclusive dining options. Among the kale salads, wheatgrass, complex proteins and superfood smoothies, you’ll find pizza, burgers, decadent desserts, fine wine, cocktails and other crowd-pleasing delights that turn a stay here into a true vacation.
The seemingly endless daily activities calendar focuses on physical, mental and emotional well-being. Offerings can include aerial yoga, stretching, mindfulness, meditation, cardio drumming, tennis and equine therapy (for an additional charge); there are also cooking classes, talks on how to curb inflammation and artistic expression workshops. Across the 400-acre property, you’ll also find hiking trails, three pools (one with poolside snacks and cocktails), a gym and a newly renovated spa — which happens to be one of TPG’s favorites.
All-inclusive rates at the Miraval Arizona Resort & Spa start at $799 or 57,000 World of Hyatt points per night, based on double occupancy.
Mayia Exclusive Resort & Spa
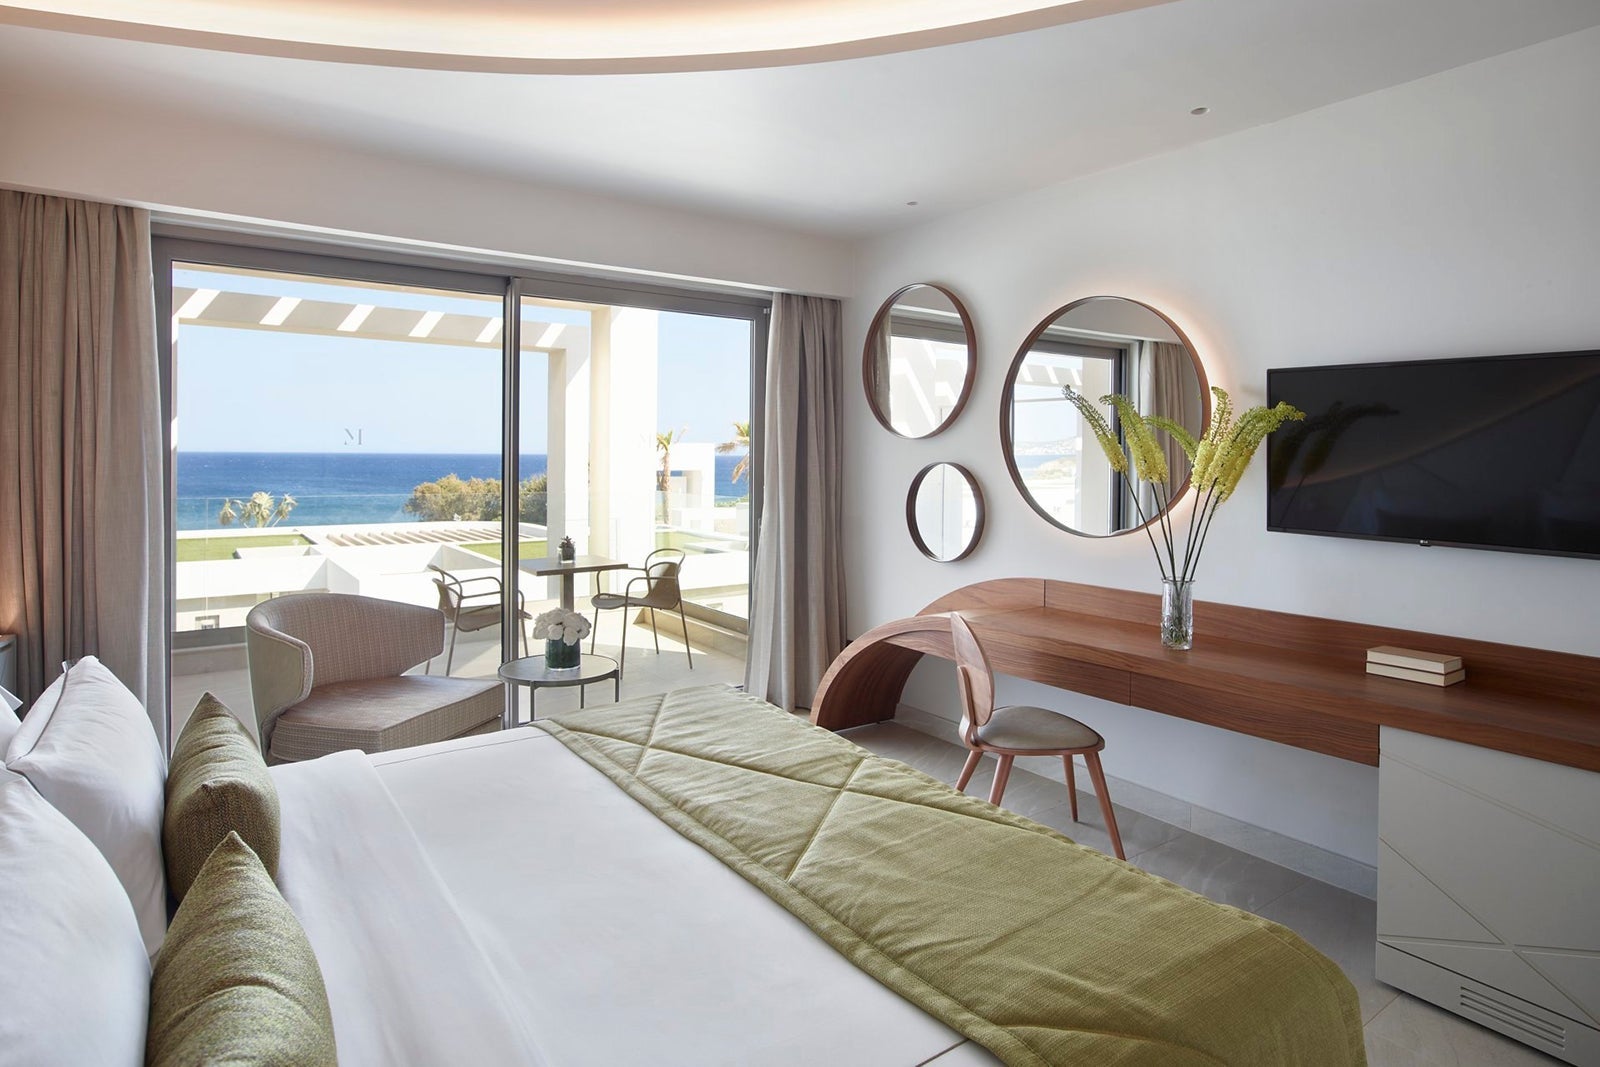
Europe may not be the obvious choice for your next all-inclusive vacation. It’s also hardly a budget option in terms of places to stay, dine and play. However, the continent has a number of accommodation options that offer it all — and one of the best is on the Greek island of Rhodes.
In Kiotari, some 37 miles away from Rhodes Airport (RHO), Mayia Exclusive Resort & Spa is a popular choice among European sun-seekers thanks to its exceptional amenities, high-quality dining and prime location close to some of Rhodes’ most beautiful beaches, atmospheric seafood tavernas, unspoiled mountain villages and one of Europe’s best-preserved medieval towns.
The modern Greek style starts in the lobby with clean lines and a white-on-white palette. Housed in clusters of low-rise, whitewashed buildings, the 250 rooms and suites are fresh and bright, with polished tile floors and simple wooden, rattan and wicker furnishings. Huge picture windows and balconies make the most of the impossibly blue Aegean Sea, while select accommodations also have swim-up access to shared pools or their own private pools.
Resort amenities include a luxurious spa, a sauna, two beautiful swimming pools surrounded by loungers and a small, private beach area. While the all-inclusive package doesn’t cover spa treatments, you can use its facilities, plus the pools and beach, and partake in all kinds of activities, including aerobics, tennis, cooking classes, themed dinners and snorkeling.
Room rates also cover all meals and drinks at the main buffet restaurant in addition to dinner at any of the three a la carte eateries, which specialize in Greek, Italian and Asian fare.
All-inclusive rates at Mayia Exclusive Resort & Spa start at $390 per person, per night.
Secrets Vallarta Bay Puerto Vallarta
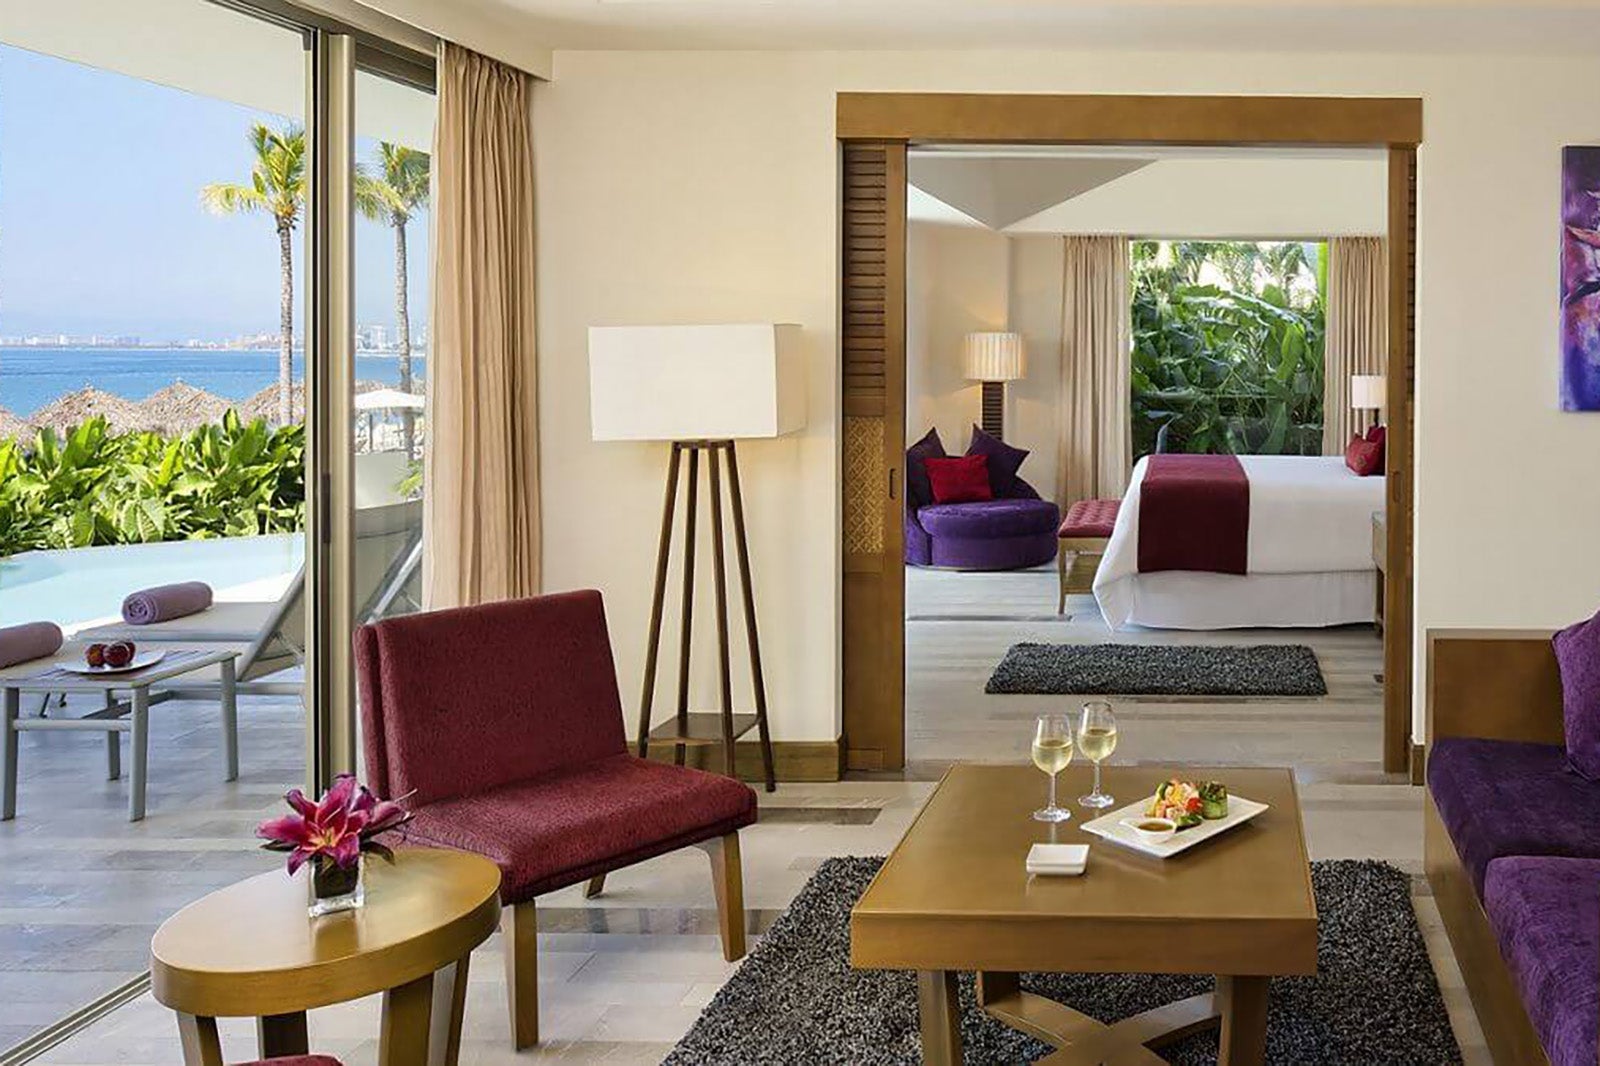
Just south of Puerto Vallarta, this contemporary 271-suite resort faces a wide, sandy beach at the southern end of the Hotel Zone and is less than 2 miles north of Puerto Vallarta’s historic center and zocalo (main square), which is dotted with restaurants, clubs and galleries.
Puerto Vallarta is known for its sizzling nightlife and cosmopolitan, LGBTQIA-friendly atmosphere, and this Secrets outpost shares that inclusive outlook. Sultry chambers trade the customary neutral palette of Secrets’ other outposts for vibrant shades of purple and red, luxe velvet daybeds, marble floors, gold woven headboards, and deep soaking tubs primed for rose petals. Glass-walled balconies allow for spectacular ocean views from any vantage point, and swim-up rooms (some of which are club-level accommodations with access to a lounge) add that extra dose of exclusivity and privacy.
Beyond the large, sun-drenched swimming pools surrounded by swaying palms and the inviting, swimmable beachfront of Banderas Bay (which is much calmer than the open Pacific), there’s around-the-clock entertainment. Competitive types can play soccer, try their hand at archery or join a pick-up volleyball game. Wellness enthusiasts can hit the spa or fitness center (charges apply for spa treatments), and snorkelers and divers can sign up for a fee-based excursion to the Marietas Islands, which are known for their incredible biodiversity.
At night, there are themed parties, movies on the beach, and live events and shows in the open-air theater.
There are five eateries as well, including Market Cafe (an international buffet), Oceana (featuring fresh seafood by the beach) and Bordeaux (where classic French cuisine is served in an atmospheric wine cellar under glittering chandeliers and frescos). Additional restaurants are available at the resort’s adjacent sister property, Dreams Vallarta Bay Resort & Spa.
All-inclusive rates at Secrets Vallarta Bay Puerto Vallarta start at $220 per person, per night, or 25,000 World of Hyatt points per night, based on double occupancy.

Stacie Harris is a local resident and reporter of the Maple Grove area. Stacie reports on medicine and science for the Maple Grove Report.