Sam Nordquist’s family struggles with his death


Photos of a man

A Minnesota man was set to meet the woman of his dreams in the fall of 2024 after connecting on TikTok. Sam Nordquist bought a round-trip ticket to Rochester, N.Y., where he expected to stay for two weeks.

But he never saw his Oakdale home again.

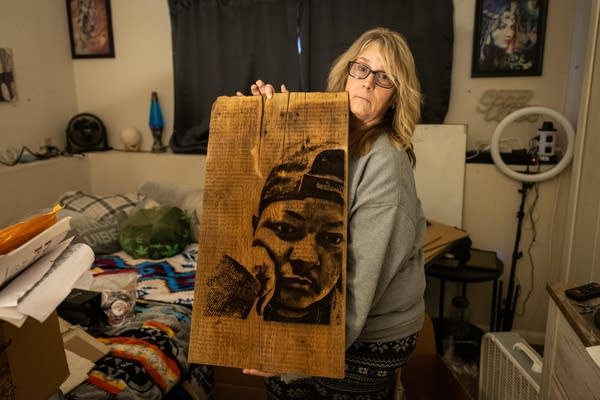
Linda Nordquist said she witnessed her 24-year-old son falling head over heels with his new girlfriend.

“They were literally on the phone, 24 hours a day, seven days a week, they would sleep on that phone,” she said.

Linda Nordquist said she spoke with Precious Arzuaga and she seemed nice. But Sam’s sister Kayla Nordquist was not a fan of the 14-year age gap between the two, she said. And the mother and sister both disagreed with Sam’s planned trip to visit Arzuaga in upstate New York.

“I really didn’t want Sam to go. I said, ‘you don’t know anybody there. We’ve never been in New York. We don’t know nothing about it. You’d have no friends, no family there.’”

Sam, the youngest of his mother’s three children, pushed back, according to Linda Nordquist.

“You have to let me grow up and spread my wings,” Sam Nordquist told his mother.

“So I said ‘fine,’” she said.

A woman holds a piece of art
Sam Nordquist’s mother, Linda Nordquist, holds a portrait of her son in his former bedroom in Oakdale on March 12.
Ben Hovland | MPR News

In late September, Linda Nordquist said her goodbyes at the Minneapolis-St. Paul International Airport.

“I took Sam to the airport, gave him a kiss on the cheek, told him be safe and to check in with me. He said, ‘I will.’”

The day of his return flight — Oct. 12 — came and went. No Sam.

Everything was fine at the beginning of the trip, Linda Nordquist said. But the calls became less frequent, and his family started to worry — to the point where Kayla Nordquist asked Sam for a video of him and Arzuaga as proof of life.

“I promise you I’m not hurting your brother. I would never hurt him. I really love your brother,” Arzuaga said directly to the camera in the recording.

A more than 2-minute video appears to show Precious and Sam in her home. Sam doesn’t speak much in the video, and Precious has her arm around Sam.

“I’ve never put your brother in a situation where he feels he’s scared. I just love him, and I care for him a lot,” Arzuaga said in the video.

A person holds a sign reading "#justiceforsam"
A supporter holds a sign honoring Sam Nordquist, a 24-year-old transgender man from Oakdale who was found dead last week in New York, in front of the Minnesota State Capitol in St. Paul.
Ben Hovland | MPR News 2025

In February 2025, Linda Nordquist reported her son missing. Four days later on Feb. 13, she and her adult children were on the road to New York’s Finger Lakes region to help in the search.

Linda brought a bullhorn so Sam could hear their voices during the search. She also had some of Sam’s clothing for the dogs involved in the search to sniff his scent.

Then, a call came in from New York law enforcement, Kayla Nordquist said. “I remember the words, ‘I’m sorry, but we found a body,’” she recalled.

Police said Sam Nordquist was physically and sexually assaulted. He was also psychologically abused. His body was found wrapped in black trash bags.

Seven people including Arzuaga and her adult son, Thomas Eaves, are accused of torturing and killing Sam Nordquist. The other defendants are Jennifer A. Quijano, Kyle R. Sage, Patrick Goodwin, Emily Motyka and Kimberly Sochia.

They have all pleaded not guilty. Arzuaga was also charged with two counts of coercion for forcing her two children, then aged 7 and 12, to participate in Nordquist’s torture.

New York investigators say Sam Nordquist was held against his will for about a month in Arzuaga’s apartment at Patty’s Lodge. They estimate he died Feb. 2 due to the multiple injuries he sustained.

Two women leave a stage
Sam Nordquist’s sister, Kayla (center), and mother, Linda (left) leave the stage after speaking at a rally in support of victims of domestic abuse and sexual assault at the Minnesota State Capitol in St. Paul on March 11.
Ben Hovland | MPR News

“Our investigators executed a search warrant at Patty’s Lodge room number 22 in the town of Hopewell as part of an investigation into the disappearance of Sam Nordquist,” Capt. Kelly Swift said in a press conference after the body was discovered. “Our investigation has revealed a deeply disturbing pattern of abuse that ultimately resulted in Sam’s tragic death.”

The suspects allegedly moved his body in an attempt to conceal the crime, investigators said.

“The facts and the circumstances of this crime are beyond depraved. This is by far the worst homicide investigation that our office has ever been a part of it,” former Ontario County District Attorney Jim Ritts said.

Former first Assistant District Attorney Kelly Wolford said Sam was restrained and had no access to his phone.

“He was denied proper nutrition and hydration. He was fed feces. He was forced to drink urine and chew spit. They physically restrained him. They forced him to obey their commands, treating him like a dog,” Wolford said.

An Ontario County Grand Jury charged each defendant with first degree murder. This charge carries the most significant penalty under New York state law, according to Wolford.

“It’s a rare circumstance where we stand before you and charge this subdivision of murder in the first degree, where it alleges that somebody was tortured to death,” she said.

A cat
Sam Nordquist’s cat Storm sits in the living room of his mother’s Oakdale home on March 12.
Ben Hovland | MPR News

The charge, she added, specifically requires that prosecutors prove that the defendants tortured Sam Nordquist.

“And that they did so because they enjoyed it. That’s what murder in the first degree is,” Wolford said.

All seven defendants will be tried separately and the first case set for trial will be Arzuaga’s in September. The other six have not been scheduled yet, but Eaves, Arzuaga’s son, and another defendant will appear in court April 22.

Nordquist was an Black transgender man. Some have asked why hate crime charges have not been applied against the defendants. Wolford said the case is bigger than a hate crime.

“Sam was beaten, assaulted, sexually abused, starved, held captive and we cannot make sense of that. We cannot put that on his gender, and we cannot put that on his race,” she said during a press conference last year. “And I know many will ask the question, why? Well, as I stand here today as a human being, we’ll never know the answer, why. Because what human being could do, what happened to Sam.”

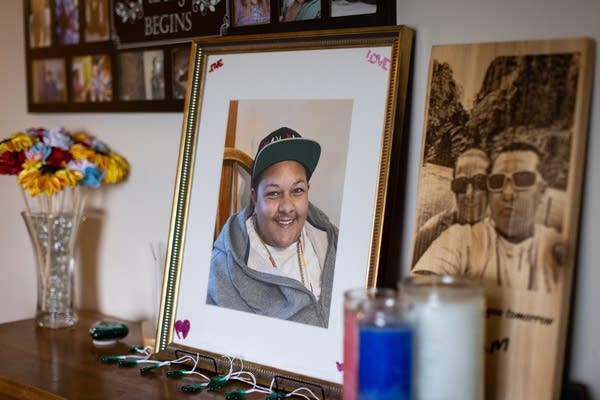
It’s been just over a year since Sam’s funeral, but his memory is still alive. His case made its way to all corners of the world. Linda Nordquist said people from all over — Africa, Ireland, Australia, just to name a few — have reached out to the family. A 1,500-member “Justice for Sam” Facebook page was created and Linda and Kayla Nordquist are active members.

A woman poses in a stairwell
Sam Nordquist’s sister Kayla Nordquist at the Minnesota State Capitol on March 11.
Ben Hovland | MPR News

But keeping his memory alive means remembering the trauma of their loss as well. Kayla Nordquist said it’s been tough.

“A whole year has gone by, and my heart feels the same. It’s completely shattered since the day I found out that he was gone,” she said. “I don’t think any amount of time will ever put it back together. I’m still heartbroken.”

The horrifying details of the case haunt seemingly average aspects of the Nordquists' daily lives.

“A year has passed, and I still have not been able to smell bleach without wanting to throw up.”

The seven defendants used bleach on Sam, according to the indictment, so they won’t use it. And Linda said she avoids certain trash bags that look like the ones wrapped around Sam's body.

“Me and Kayla won’t use a black garbage bag with gray handles. I have turquoise,” she said.

Linda Nordquist, Kayla Nordquist and her three children recently drove to New York for some meetings with the new Ontario County District Attorney and his staff. They also visited a willow tree planted last June for Sam Nordquist. It’s right on Canandaigua Lake, one of the main Finger Lakes.

A woman and her young daughter stand next to a tree growing on a lake shoreline. Snow has blanketed the ground.
Kayla Nordquist and her daughter Peyton stand next to a willow tree in Canandaigua, N.Y., in March. The tree is dedicated to her brother Sam Nordquist, who was tortured and killed last year in nearby Hopewell, N.Y. The tree is in Lakefront Park on Canandaigua Lake.
Courtesy of Kayla Nordquist

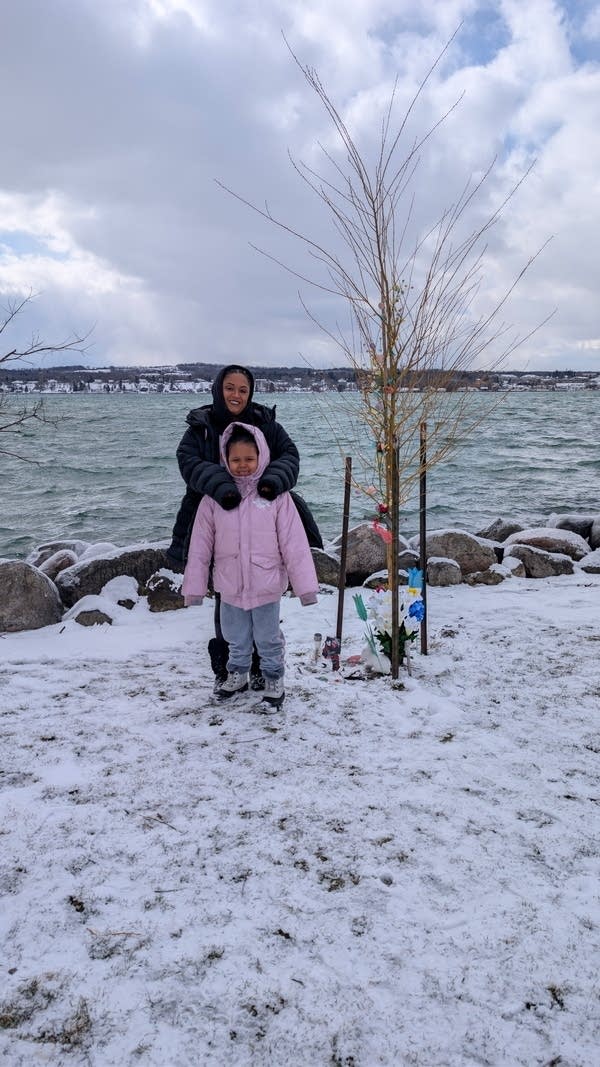
Rochester, New York-area supporters of Sam Nordquist and his family have raised money for them after his death. Some advocates are working to honor Sam Nordquist again with a Japanese cherry blossom tree to be planted in Oakdale — where he lived with his mother.

When all seven trials are over, Linda Nordquist plans to move out of the home she shared with her son, she said.

“When I do move, I am taking pictures of Sam’s bedroom, and I’m gonna have it replicated,” Linda Nordquist said. “It’ll be how he has it. In a new place.”

Sam’s mother and sister said they will attend every trial in his case.


Source link

Leave a Reply

Subscribe to Our Newsletter

Get our latest articles delivered straight to your inbox. No spam, we promise.

Recent Reviews


What is big data visualization?

Big Data Visualisation is one of the most essential aspects of communicating with a range of Big Data Analytics solutions. Once the stream of raw data is portrayed with pictures, the decision-making process becomes so much simpler.

Big Data Visualization includes the presence of about any sort of data in a graph form that refers to a process and evaluate. But it means going well beyond standard government charts, bar graphs and powerpoint presentations to more complex representations such as heat maps and fever charts, allowing business leaders to discover sets of data to recognise commonalities or unanticipated trends.

Scaling is the key characteristic of Big Data visualization. Today’s businesses are collecting and storing huge amounts of data which would take many years for a living thing to read, nor even realize. However, studies have found that the human retina can send signals to the nervous system at a rate of about 10 megabits per second. Big Data Visualization focuses on potent computer systems to consume raw corporate data and analyze it to create graphical representations that allow individuals to capture and recognize vast amounts of data in seconds.

[ Related Article: VMware VCloud Director Training ]

Big data visualization tools:

You should use the proper tools for data visualization and know how to switch the knowledge and practical information generated from Big Data into the benefits of quicker response.In order to meet or exceed the demand of the consumers, a set of features should be provided by the Big Data visualization tools such as ability to process multiple data coming from different sources, applying various filters to achieve good results, able to interact with large data sets, providing collaboration options for the customers and able to connect with other softwares, etc.

Regardless of the fact there are a ton of special hardware for Big Data visualization, both open-source and customizable, there is a collection of them which exists out a little slightly as they provide all and many of the other functionalities noted above.

Big Data Hadoop Training

  • Master Your Craft
  • Lifetime LMS & Faculty Access
  • 24/7 online expert support
  • Real-world & Project Based Learning

Challenges posed by big data visualization:

Big Data visualization can be an enormously potent company ability, but some key changes must be made before an organization can take full advantage of it. This included the following:

  • Availability of big data visualization specialists or experts.
  • Managing the quality data, ensuring the accuracy is important before storing it for the organizational use.
  • Visualization of hardware resources to make good decisions in a timely manner.

In this blog post we are going to discuss the top big data visualizations tools in the current market. You can select the ebay one based on your requirements.

Top big data visualizations tools:

In this section, we will discuss the best big data visualizations tools. A brief review of the market system of Big Data tools indicated the existence of famous players, such as Microsoft, SAP, IBM and SAS. And there are a number of specialized software companies providing largest big data visualization tools, including Tableau Software, Qlik and TIBCO Software. Leading tools of big data visualization includes the following list.They are:

  • Tibco Spotfire
  • Qlikview
  • Watson analytics
  • Fusion charts
  • Tableau
  • Sisense
  • Data wrapper
  • Infogram
  • Plot.ly

More info, Visit Openstack Administration Training

Tableau:

Tableau is among the largest software on the data visualization market that allows the production of different types of graphics, charts, dashboards, stories, maps and other components without programming.

It contains additional operations of descriptive statistics and inferential statistics with the creation of analytical charts. Enables collaboration of other techniques, such as Excel, SQL, SAP, Amazon, and others.

Plot.ly:

Plot.ly is a place to share online codes and visuals to assist users and developers.Graphics are made accessible to the community, that also enhances and enhances learning.The visual appeal of well-designed visuals with high-resolution graphics is a strong point.Although much more configured for Python, Plot.ly supplies R, Shiny and JavaScript libraries with the generation of distributed panels.

Qlikview:

QlikView is a component of Qlik, a software company based in Radnor, Pennsylvania, USA. QlikView is among the quickest business intelligence and data visualization tools that is convenient to use. It provides an Associative Search that makes decision-making uncomplicated. Its Associative Experience allows you to focus on the most relevant information, whenever and wherever you need it. It offers significant coordination with co-workers and partner organisations, a relative analysis of data, allows you to incorporate your relevant information into a data app and ensures that the right employees in the company have access to data through its dependable safety features.

Tibco spotfire:

Tibco Spotfire is a data analytics technology that offers you specific insights into your data. It’s accessible in Desktop, Cloud and Platform Editions. It has an Intelligence recommender system that significantly shortens visual analytics time. Its data chasing feature lets you better spot data outliers, discrepancies, and inadequacies. During the 2010 World Cup, FIFA used the apps to provide audiences with data analysis of previous achievements by country teams. Power users of Spotfire include Procter and Gamble, Cisco, NetApp, Shell.

Join our IOTA Training today and enhance your skills to new heights!

Cloud Computings, big-data-visualization-tools-description-0, Cloud Computings, big-data-visualization-tools-description-1

Subscribe to our YouTube channel to get new updates..!

Watson Analytics:

Watson Analytics is an IBM cloud-based analytics service that helps you easily find insights into your data. When you transfer your data to Watson Analytics, it will demonstrate the questions that will help you reply and then provide immediately focused data visualizations. You can also start exploring your data through natural language processing. Other key features involve computerized predictive analytics, one-click assessment, intelligent data discovery, streamlined analysis, available advanced analytics, self-service dashboards. Watson analytics also allows computer vision, which in turn provides more informative information from the data.

Sisense:

The easy-to-use configuration empirically derived trouble-free operation to non-techists. It performs an ad-hoc implementation of various data and empowers you to collect data from all your systems into a single and available repository, making it a single platform that manages the entire business intelligence workforce. It can also evaluate data in real time. For instance, during the peak season, sales trends have to be observed, they can provide a great insight into the vast amount of data that can be traced as quickly as possible. Popular customers include eBay, Merck, NASA, ESPN and SONY.

Data Wrapper:

Datawrapper is a simple platform for making visualizations such as infographics, maps, data tables and responsive charts such as line, bar, stacked bar, donut, etc. It is popular among publishers and journalists. Popular users include The Washington Post, The Guardian, Buzzfeed and The Wall Street Journal. It’s very easy to use and there’s no need for a coder to use.

Microsoft Power BI:

Microsoft Power BI is a business analytical tool that makes it easy for businesspeople to conceptually evaluate their data and develop strategies based on it. It gives access to on-site and in-cloud data. It has two pricing plans, one of which can be purchased free of charge. The free one comes with a 1GB data limit, which allows you to create, create and share dashboards and reports. Power BI Pro has all the power BI features, can consume live data with full interactivity, share data queries through the Data Catalog, and more.

Empowering Your Success: On Job Support Services for Seamless Performance.

Infogram:

Infogram is a data visualization and infographic company founded in 2012 by Uldis Leiterts, Raimonds Kaže and Alise Semjonova. It allows you to choose from more than 1 million images to make infographics. It makes it easy to access data by allowing you to edit the data in the editor and connect to your desired cloud service. Some of the customers are Deloitte, Nielsen, Skyscanner, and MSN. Easy-to-use steps find it easier for educators, journalists and business professionals to envision their data. It has produced over 4.8 million infographics, which are viewed by more than 500 people a month.

Fusion Charts:

FusionCharts is a component of InfoSoft Global, a systems integrator of data analysis products. It is used by more than 80% of Fortune 500 companies. The idea of FusionCharts came from 16-year-old Pallav Nadhani in 2001, who found himself unsatisfied with Microsoft Excel charting abilities while finishing his school assignment.

Big Data Hadoop Training

Weekday / Weekend Batches

 Conclusion:

Visualizing Big Data can help the company gain new knowledge and make strategies that can bring revenues and make them realize their clients.Both data visualizations and visualizations turn data into images that anybody can probably recognize as extremely valuable tools to explain the importance of digits to people who are more visually oriented. All the tools mentioned above helps the organizations in getting good and profitable results for the business.

Related Article:

Hpe Synergy Training

Facets Interview Questions


Source link