
Anaplan Dashboard | A Complete Guide on Anaplan Dashboard


Anaplan Dashboard – Table of Content

Introduction to Anaplan

Anaplan is the best business planning software company located in San Francisco, United States of America. Anaplan software sells subscriptions for cloud-based business planning software and also offers the data for decision-making tasks. The main purpose to develop Anaplan software is to build a platform to connect people around the world, data, and create an effective business plan. Anaplan software also delivers a unified real-time, cloud-based environment to optimize the planning, and also facilitate the decision-making capabilities to a different operational level.

To gain in-depth knowledge with practical experience, then explore HKR’S Anaplan Training!

Anaplan Dashboard

Anaplan dashboard is a combination of the grids, and charts used to design models, or business planning designs. This dashboard allows users to include n number of elements depending on their requirement. It’s very user-friendly and easy to use. The below diagram gives a simple glimpse of the Anaplan dashboard. 

Types of Anaplan dashboards

Below are the important dashboard types that are designed to direct a particular user guide. They are;

  • Landing dashboard: this is the first set of Anaplan dashboards, which is visible when you log in to the Software. This type of dashboard is very simple, concise, and also directs users about the tasks they need to undertake, and provides relevant information related to actions. 
  • Operational dashboards: this type of dashboard displays the data which illustrate the day-to-day business activities. The operational dashboard also allows users to include real-time data to perform business operations smoothly.
  • Strategic or executive dashboard: this type of Anaplan dashboard provide the executive with a high-level overview of the various business functions along with opportunities and ideas.
  • Analytical dashboard: this type of dashboard displays operational or strategic data in the form of drill-down and also helps users to explore slice and dice to reveal various data insights.

Get ahead in your career with our Anaplan Tutorial!

Anaplan Training

  • Master Your Craft
  • Lifetime LMS & Faculty Access
  • 24/7 online expert support
  • Real-world & Project Based Learning

Dashboard framework

There are three parts that are important to build a framework, they are;

Let us discuss them one by one:

    • The Header: this framework building block mainly focuses on navigation and global page sectors such as time, version, geographic locations, etc. With the help of the header section, you can also place the most used dimensions to the top left of the screen. The header enables you to read a screen in much the way they read a book.
    • The body: this body section contains grids and charts, also sometimes images. Always remember one thing: try not to add many elements on the dashboard and make sure that the grip elements are consistent for all the elements, keep column width consistent, brief the label width wherever it is required. The “simplicity” is a key to creating a dashboard and trying to create it by using four-quadrant approaches in the body of the dashboard.
    • The footer: this is an optional step and also offers pointers to the next activity or buttons to trigger the actions.

Dashboard layout

To improve the dashboard usability, follow the below guidelines or layout design.

  • The language which you select on the dashboard must reflect the language that includes jargon, or errors. More importantly, it should feel like an easy to use customized environment.
  • Decide on how you are going to access the dashboard using desktop, tablet, or mobile? While customizing the dashboard, you should have a clear idea of how you are going to use it, it’s good to use a screen resolution. 
  • Last but not least, think about how wide your audience is? Are they need any special requirements? Any color blindness?

As a designer, you must keep all these things in mind while designing a dashboard.

Important factors about Dashboard layout:

  • Don’t ever clutter the dashboard, try to keep it simple and more effective.
  • Consider building a landing dashboard in the four quadrants. This is one of the simplest layouts to create and is also quick to comprehend.
  • Think about splitting the models into inputs, calculations, and outputs. The more important thing is that the dashboard should effectively display the outputs.
  • Always try to build a dashboard in a top-down approach that should contain a dashboard summary at the top and a description at the bottom.
  • Set the height and width pixel settings to -1 to ensure that all the elements must automatically adjust to the screen size.

Using Anaplan features in the dashboard:

  • This enables synchronization where users can make use of real-time data.
  • Most importantly if there any conditional formatting statements need to be added to the data before any item will be added to the dashboard.
  • Make use of the dashboard element menu to narrow the focus on the data model, or filter the view of the grid. These modifications should reflect on the dashboard.
  • For a chart, users need to list out the multiple elements, and they need to reduce the view of the chart by clicking on a chart series to hide that series and rescale the chart axis.
  • Use the drill-down method to view important formulas and the grid details,( the navigation to add this option is as shown below:  go to the context menu -> right click then click on “drill-down”).
  • You should be aware of the currency format, and dont forget to define them if the dashboard refers to a single currency.
  • Are you using any decimal number, and be sure to define appropriate fixed numbers.
  • Remind your users about the search function with the help of two options, 

They are;      

a.context menu 

b.dashboard menu element.                                                                     

  Top 30 Anaplan Interview question & answers for 2020

HKR Trainings Logo
Subscribe to our YouTube channel to get new updates..!

Dashboard and data access

In contents, users view the modules and dashboard they have been using to access. These modules and dashboards are organized into functional areas (that means meaningful groups that are easy to navigate).
Assigning data access to a specific role, and also limiting access to particular modules and dashboards. To make this process robust, follow these steps to robust data access:

  • When creating roles, employ a need-to-know approach to the data processor. This ensures that the roles realistically represent the activities of user groups.
  • You need to dashboard that is targeted directly to the requirement of the role. It’s always good to have three simple dashboards, which are directed to three different roles, rather than one dashboard that displays the data with an appropriate user.

Dashboards -Selective access:

This is nothing but a combination of both selective access and menu option that offers an administrative workspace with a fine level of granularity to control user access to the dashboard.

 First, let’s start with selective access:

Anaplan dashboard respects the selective access set across model:

The navigation to follow:

  • Roles -> version dashboard elements only display the versions to which the user has access.
  • Roles -> Modules dashboard that is available to the user if they have read or write access to all of the module elements are published from.
  • Selective access on lists dashboard elements that only display list items to which the users have access.

Dashboard- menu option:

  • The administrator can set up user access for each dashboard grid element individually.  When an administrator selects a grid or chart element, the menu options are displayed in the dashboard designer properties panel.
  • The menu that is accessed from the dashboard element menu option provides the basis for the organization of menu options. For example, you can choose the pivot function from the view menu (this is also known as view-Pivot).
  • Similarly from the menu option, you can control whether the user can use the import function (this can be done using data-import).
  • The open source module controls whether a user can open the module that is the source of the grid or chart element.
  • To access the menu option, you can select the option that you want to make available to the end-users and clear the option that you want to hide from them.
Anaplan Training

Weekday / Weekend Batches

Final Words

There are a lot of different dashboards available on the market, but choosing the best one takes time and you can think that it is a big challenge. Anaplan dashboard has not only been developed to help IT people but also non-IT and business analyst professionals. The main purpose to use the Anaplan dashboard is to offer a subscription service for the cloud application/ software and also helps designers to create a business plan or customize the dashboard according to their requirements. In this Anaplan dashboard post, we have explained you the dashboard types, overview, framework, selective access, and menu options.


Related Article:


Source link

Leave a Reply

Subscribe to Our Newsletter

Get our latest articles delivered straight to your inbox. No spam, we promise.

Recent Reviews


A Brief Introduction to The SAP HANA:

SAP HANA is in-memory management, data-oriented, and relational development management system developed and produced by SAP SE enterprise corporation. The primary function of SAP HANA is to manage database applications, store, and retrieve the data as requested by the enterprises. SAP HANA stands for “High-performance analytic appliances” and is a combination of both hardware and software appliances. This module is a data foundation technology that offers advanced-level data analytical and multi-dimensional management data-driven applications. SAP HANA product written in JAVA, and C programming languages.

  Become a SAP Hana Certified professional by learning this HKR SAP Hana Training 

SAP HANA – Core Architecture

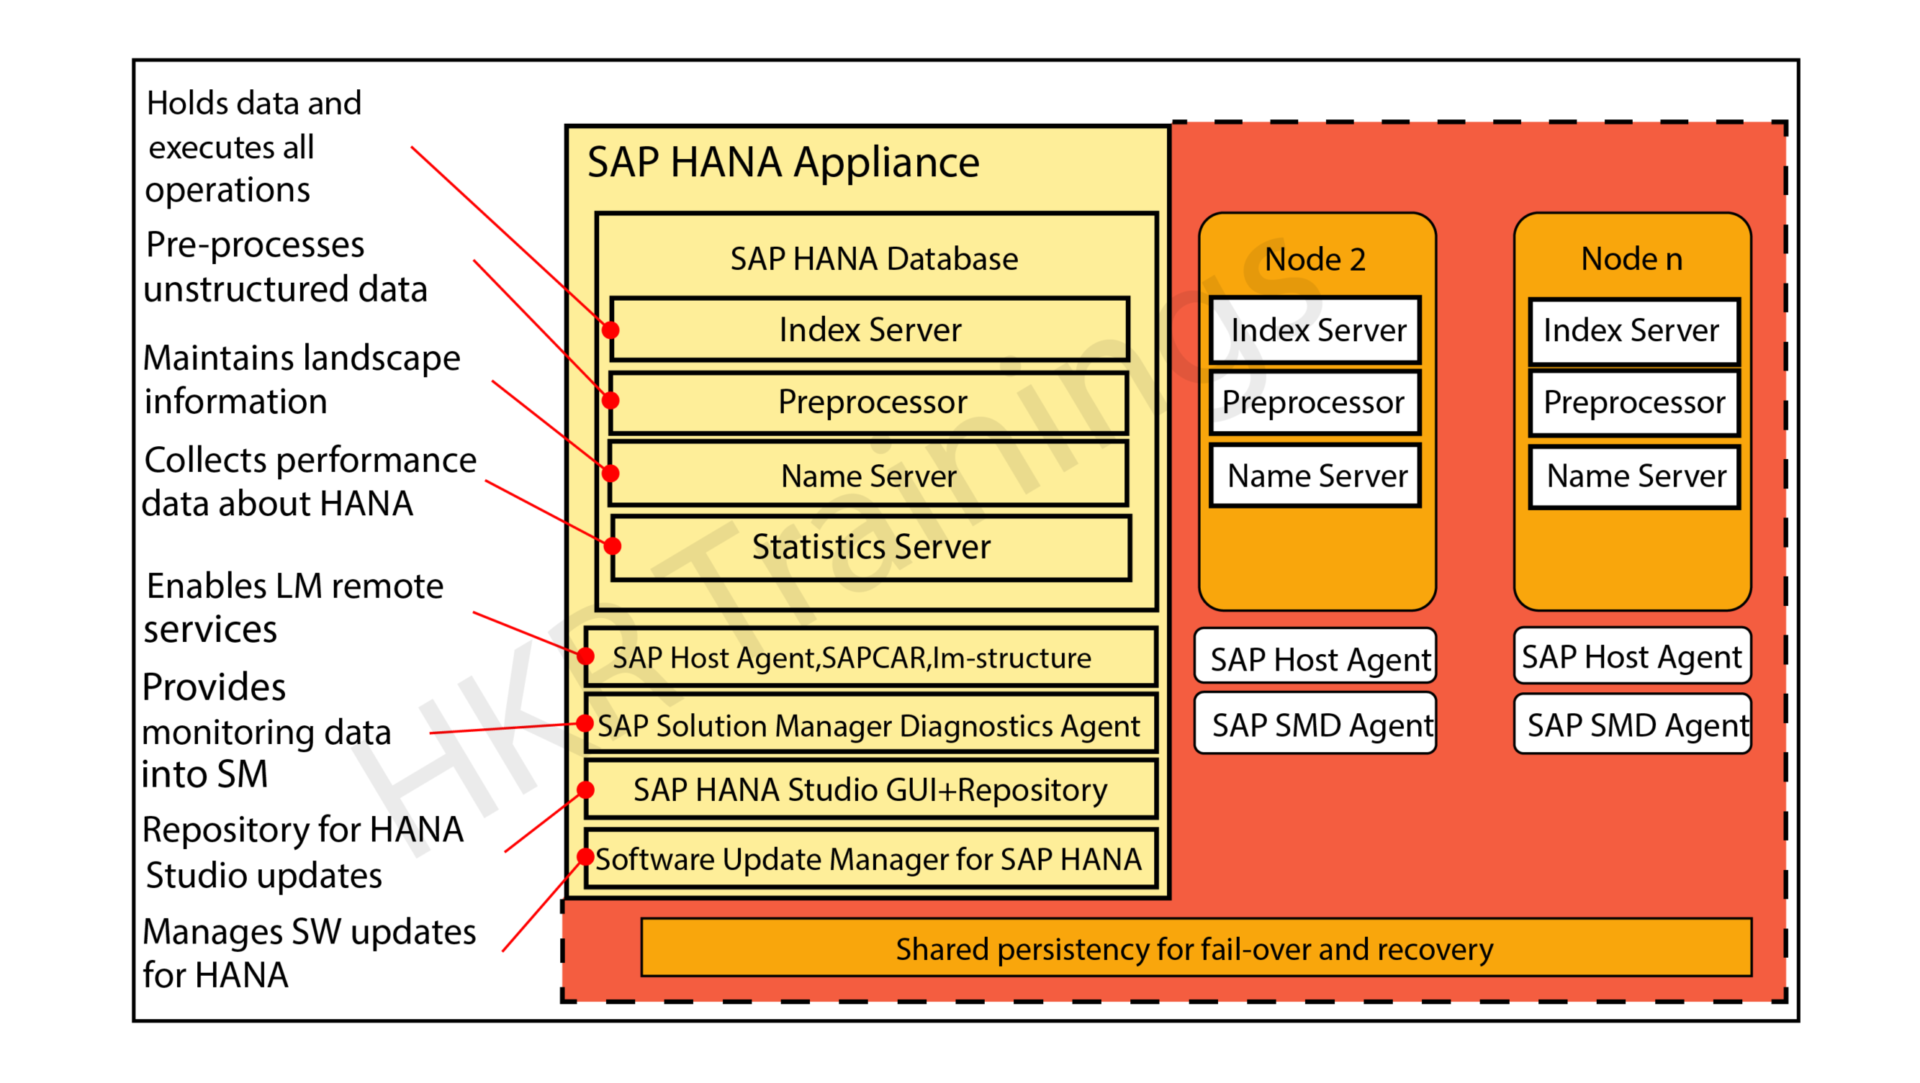
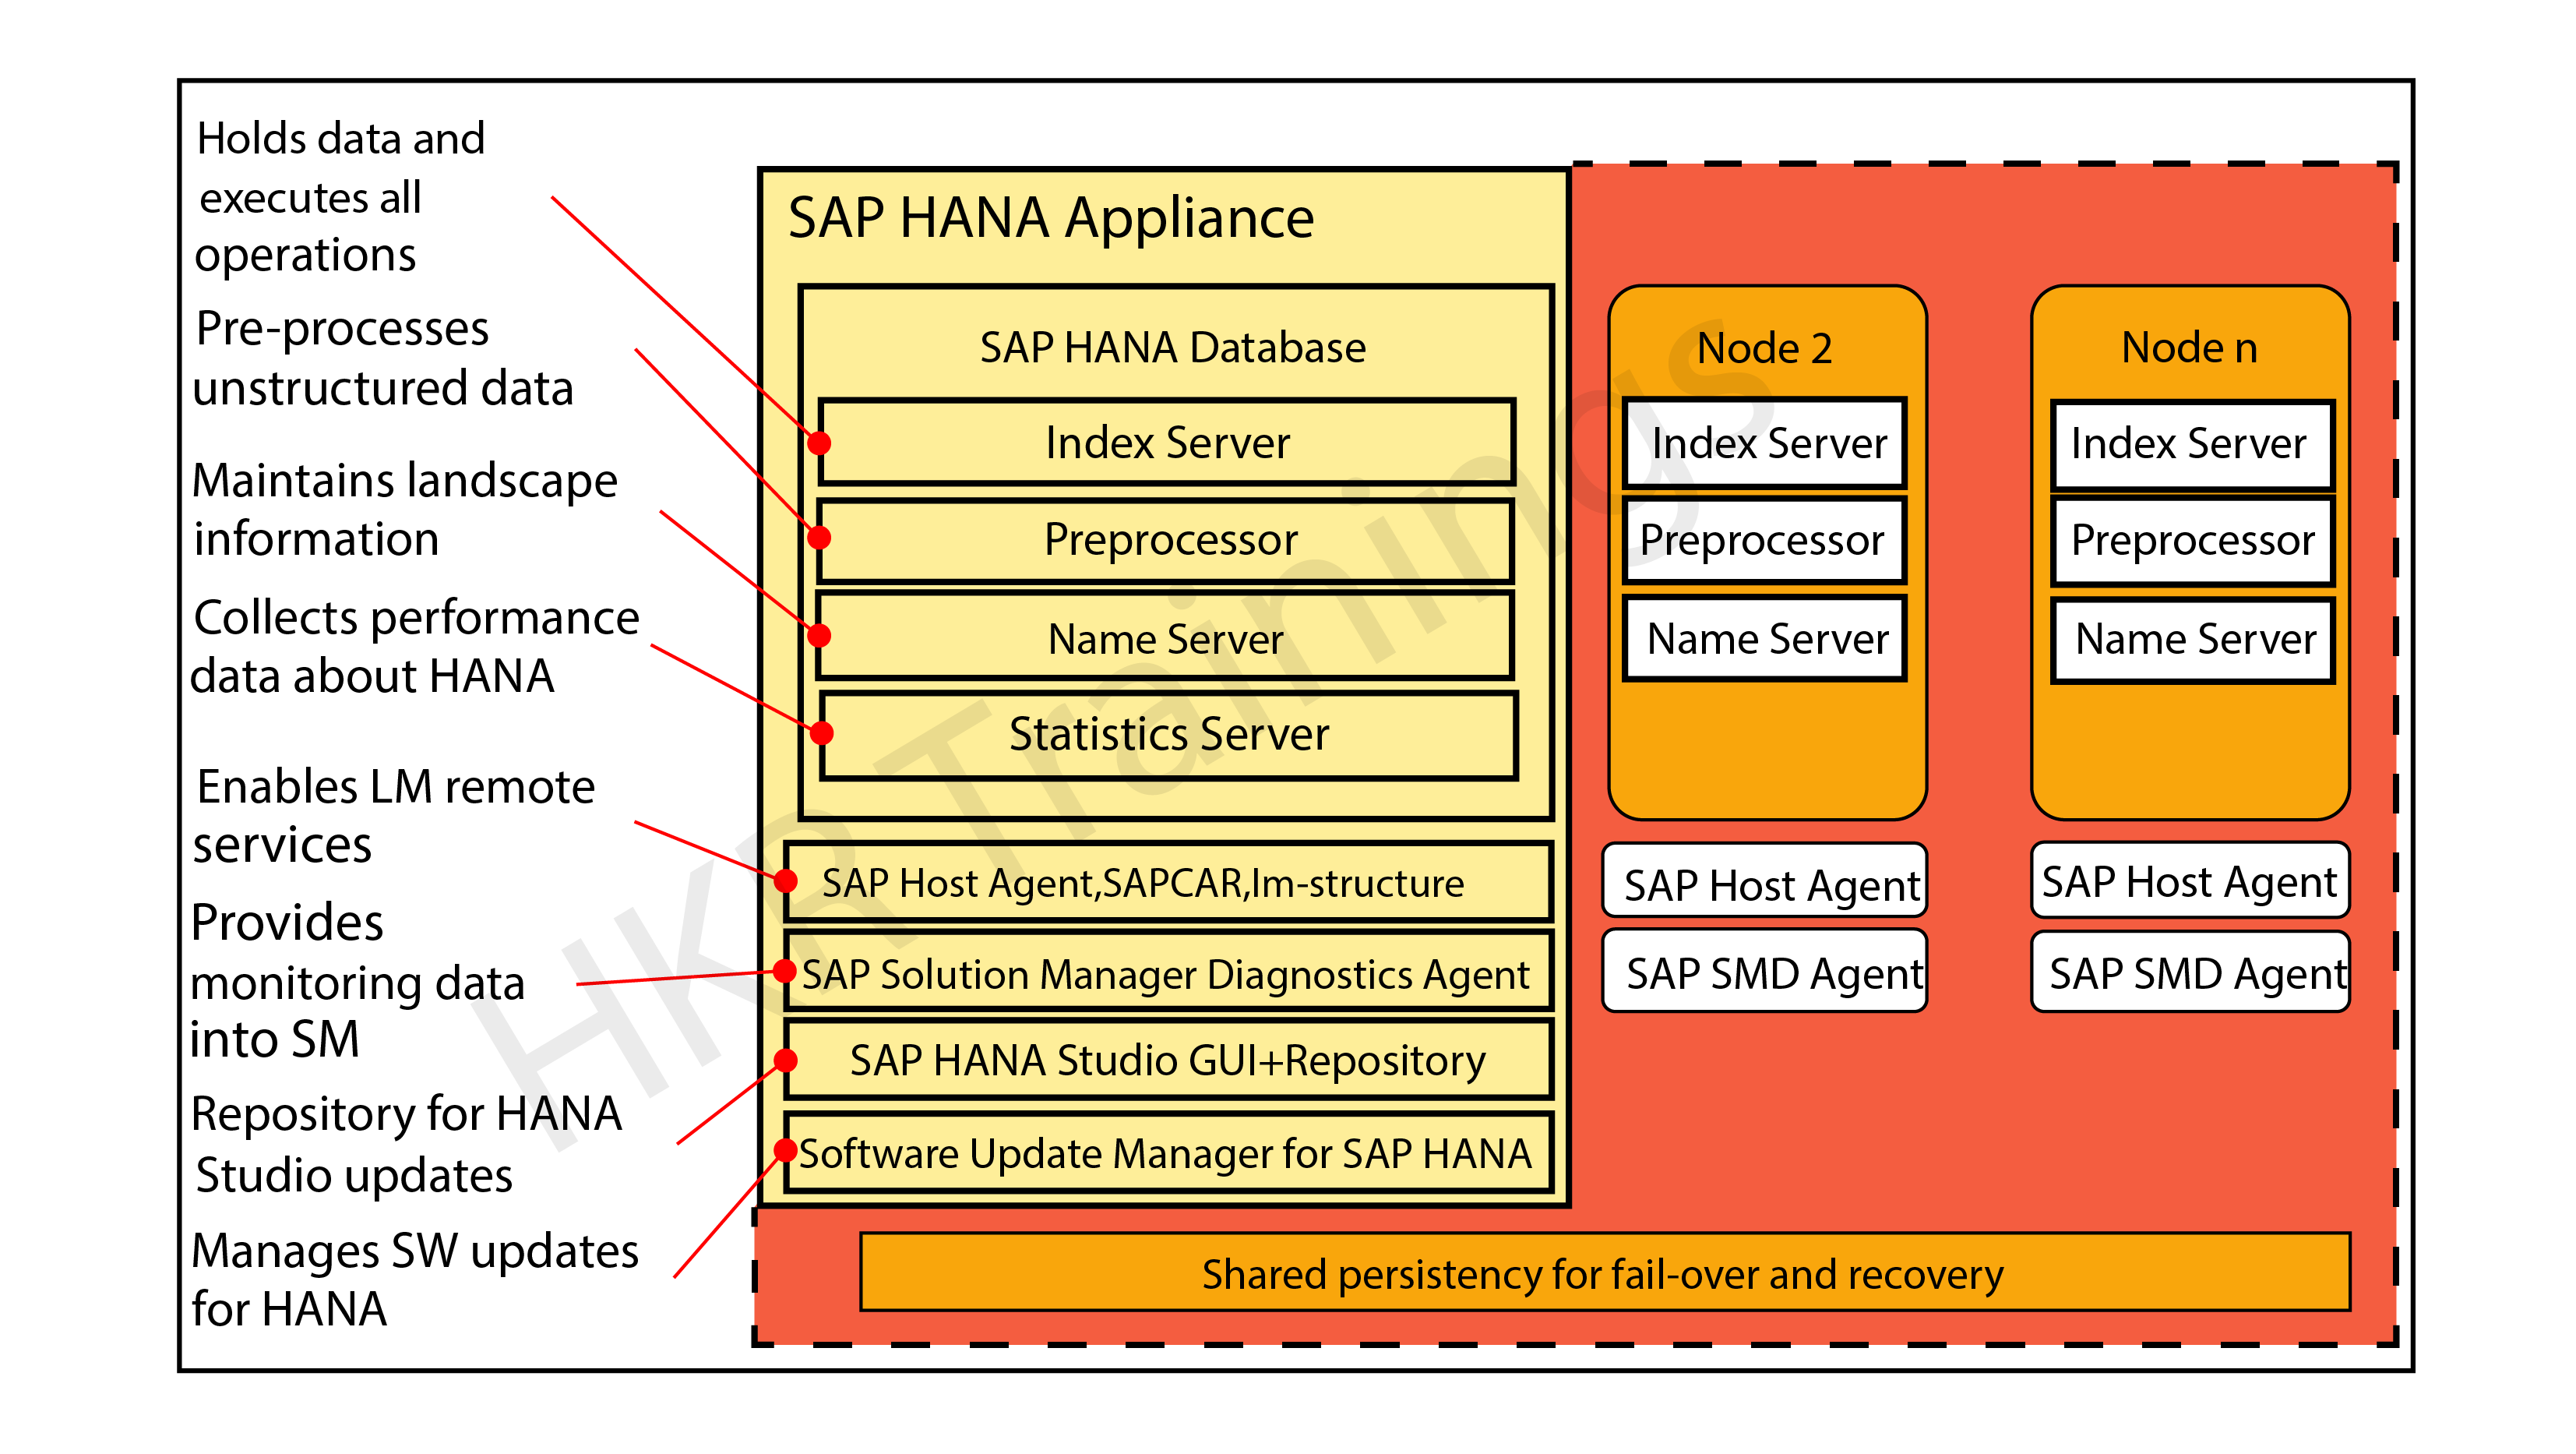
The below diagram explains the core components and work nature of the SAP HANA module:

SAP HANA  Core Architecture

As we already know, the SAP HANA platform is developed with the help of C and JAVA programming languages and designed to run on operations systems like LINUX server enterprise edition 11. Sap HANA consists of multiple components that help to perform many activities. The most important component of SAP HANA architecture is an Index server which consists of an SQL/ MDX processor to handle any type of query statement. The SAP HANA system contains different servers like name servers, statistics servers, XS engines, and preprocessor servers. All these servers are used to communicate and host multiple web applications.

 Let’s know the core components one by one:

Index server:

The index server is an important component of SAP HANA architecture. This server is also known as the heart of the SAP HANA database system. An index server contains the original data and engines to process the data. This type of server takes care of the entire data request and processes them when they are mixed with SQL and MDX. The index server also consists of a data engine to handle all the query statements (SQL/MDX). This also holds a persistent layer used to check the durability of the HANA system and restore the data.

This figure illustrates the overall architecture of the Index server:

Index server

In the above diagram, you can see Index server also consists of a session and transaction manager, this is used to manage transactions and keep tracking of them.

SQL/MDX Processor:

The SQL/MDX processor type is responsible for processing the SQL/MDX data transactions with data engines to run different queries. It requests all the segments to correct the engine for performance optimization. In this processor type, data authorization also handles all types of errors. MDX or multi-dimensional expression is a query language used in OLAP systems like sequential query language and relational database management systems. The planning engine is responsible to run the planning operations within the database. The calculation engine converts the data into calculation models to build logical data execution. The stored processor executes the procedure call to optimize data processing. The persistent layer is also responsible to check durability and atomicity in SAP HANA systems and also manages the data and transaction logs to manage data backup, HANA system configuration, and log backups.

Preprocessor: This component of the SAP HANA architecture enables users to preprocess the data.
Name server: This SAP HANA component allows users to maintain landscape information.
Statistics server: This SAP HANA component collects information about the SAP HANA server.

Check It the Sample Resume SAP HANA SAMPLE RESUME!

Why SAP HANA is so popular?

The following are the important features of SAP HANA that make the technology so popular in the current business platform:

1. SAP HANA acts as an eclipse editor and web-based editor (also known as pick-up and drop services) to support the graphical creation of business applications.

2. Provides Source agnostic data access and integration services that allow accessing and indexing external data from across the entire organization. Add these analytical services to existing analytical models.

3. Real-time data analytical processing can be performed to analyze business operations in real-time using the huge volume of detailed information while business happening.

4. Data can be accumulated from many applications and data sources without disturbing in any way that continuing business operation.

5. View of business information can be carried on in a persistent data repository and built again in case of a crash.

Key benefits of the SAP HANA:

After knowing all the major factors and core architecture of the SAP HANA, now it is time to have a basic idea of the key benefits of the tool. It is necessary to know the importance of the platform before relying on implementation.

Below are the few advantages of SAP HANA:

1. Offers in-memory management: this type of in-memory allows for sophisticated data calculations.

2. Acts as calculation engine: In-memory processing gives more time for relatively slow updates to column data.

3. Provides massively parallel processing: MPP optimized software enables linear performance scaling making sophisticated calculations like allocations possible.

4. Larger storage: The columnar storage increases the amount of data that can be stored in limited memory (compared to disk).

5. Row +Column database: Column databases enable easier parallelization of queries. And Row database provides fast transactional processing.

SAP HANA Tutorials for beginners get started with your SAP carrier 

HKR Trainings Logo

Subscribe to our YouTube channel to get new updates..!

Differences between SAP and SAP HANA:

We think that before getting into the SAP HANA, it is mandatory to know the standard differences between the SAP and SAP HANA. Let us know them one by one:

SAP:

1. SAP is a traditional ECC business enterprise application.

2. In SAP, nearly all the SAP transaction codes are available and there is no concept of data simplification.

3. it’s easy to access all the functional modules of SAP and helps you to create real-time data reporting.

4. Also offers additional performance and the SAP solution also boasts amended transactions.

5. Upgrade to ECC6 enhancement package 7 and then perform a database management activity.

SAP HANA:

1. Helps to rebuilt to capitalize the significant simplification that the SAP HANA platform provides.

2. This is a packaged solution that has SAP ERP at its core optimized to run on the HANA platform.

3. Helps to integrate and leverage various solutions and technologies in SAP arsenal.

4. Achieve data simplification. This is achieved by replacing the core tables within certain processes with a single table.

5. SAP HANA is designed with SAP flori for a richer user experience and is easily configurable on cloud technology.

Different types of SAP HANA system monitors:

The SAP HANA system monitors are used to control various tasks like Log disks, Data Disks, trace disks, and alerts on resource usage.

Let me explain them one by one:

1. System ID: this helps in the ID assigned to the system when added to the studio environment.

2. Operational state: maintains the overall system status.

3. Alerts: This monitor is used to check the system issue alerts when resource usage and thresholds are violated. In general, these alerts are categorized into low, medium, or high priority.

4. Data Disks in (GB): this indicates the size of the data volume available on disk.

5. Log disks in (GB): this indicates the size of the log volume on the disk.

6. Database Resident Memory management: this indicates the size of the memory used in an operating system to manage SAP HANA database processes.

7. Used memory: Here is the amount of physical memory that is used by the SAP HANA database.

8. CPU in (%): This helps to know the percentage of CPU that has been used by the SAP HANA database.

9. Hostname: it indicates the name of the server hosting used in the SAP HANA database.

10. Instance Number: here the Instance number is the administrative unit that consists of the various server software components.

11. System trace disk in GB: it gives the total disk space used on the disk that contains trace files.

12. System physical memory in GB: this gives the total amount of physical memory used.

13. Distributed: this indicates whether the system is running on any single web host or this will be distributed in the system.

14. Start time first: this indicates when the time that first started and value is restarted for any important reason.

15. Versions: this indicates the software versions of the SAP HANA environment studio.

16. Platform: this indicates the different operating systems where the SAP HANA studio is running.

17. Number of crash dump files: here is the number of crash dump files removed in the SAP HANA system.

Top 30 Frequently asked SAP HANA Interview Questions 

SAP Hana Training Certification

Weekday / Weekend Batches

Final words:

SAP ERP market is booming like a rocket and it is a good career choice to pursue your IT profession latest Gartner report. The real reason behind developing this SAP HANA architecture is to get some knowledge concerning workflow and design factors. Reading this post has given our readers a complete idea to learn and explore concepts like Key benefits, reasons for SAP HANA’s popularity, differences between SAP and SAP HANA, and the architecture components. 

Related Articles:

  1. SAP HANA Modules


Source link