50 years of Apple pushing tech forward, for better or worse


Over the last 50 years, Apple reimagined personal computers, catalyzed the era of the smartphone, enlarged an iPhone and called it the iPad and garnered a strong position in wearable tech through its Watch series and its AirPods. It also popularized software and services like its App Store, FaceTime, iCloud, iMessages and many more. For a lot of us, the first time we pinched-to-zoom on a photo was likely on an iPhone.

However, Apple gives and it takes away. Things have had to change, be removed and consumers have to move on to whatever’s new. For better or worse, the weight of Apple’s influence has led to entire product categories following suit. Or, more typically, there’s resistance, complaining and then… following suit. With the benefit of hindsight, most of these cases are examples of Apple seeing where technology was going and getting ahead of a transition that would have been inevitable. Often, these transitions have caused short-term pain for some, but time has proven Apple (mostly) correct about dropping older tech.

As Sir Arthur Quiller-Couch once said: murder your darlings. Here are some of the darlings we’ve lost over the years.

The death of the disk drive (1998)

This is a two-parter. The iMac G3 marked Steve Jobs’ return. The colorful all-in-one Mac was a new start in many ways. In 1998, Apple ditched the standard ports and myriad cable types of personal computers, going all in on USB and a little-known thing called the internet. (In fact, that’s what the ‘i’ in iMac stands for.)

In doing so, it also ditched the 3.5-inch floppy disk drive — although it did have a read-only optical disk drive. Even with sluggish internet and USB transfer speeds at the time, the convenience was plain to see and it led to a decade of thumb drives of ever-increasing storage limits. High-capacity alternatives to the floppy disk, like the Zip disk and even Minidisc, attempted to bridge the gap, but never gained the widespread traction and adoption of the original disk drive. But flash drives and, later, internet-based file storage quickly made them obsolete anyway. Apple was just a little early with its dismissal.

Portable music players (2007)

Despite Apple’s iPod being the de facto music player at the time, it was supplanted by the company’s own biggest hit: the iPhone. At its peak, the iPod made Apple the zeitgeisty tech company it is today. It dominated the MP3 player market, and by 2006, iPods were responsible for 40 percent of the company’s revenue. And that was before the era of Apple including a free U2 album with every iTunes account.

When the iPhone launched in June 2007, it was swiftly followed by the iPod Touch in September. This was the iPhone without the phone part — indicating how the company saw the future of music listening. You didn’t need an iPod if you already had an iPhone in your pocket. It’s the best example of Apple cannibalizing a product that defined a decade with something far more impressive and, eventually, more successful.

It was a slow death. Ignoring the countless MP3-playing rivals, (RIP Zune), Apple dropped the classic iPod in 2014. It soon did the same to the tiny iPod nano and iPod shuffle in 2017. Finally, the company discontinued the iPod Touch in May 2022.

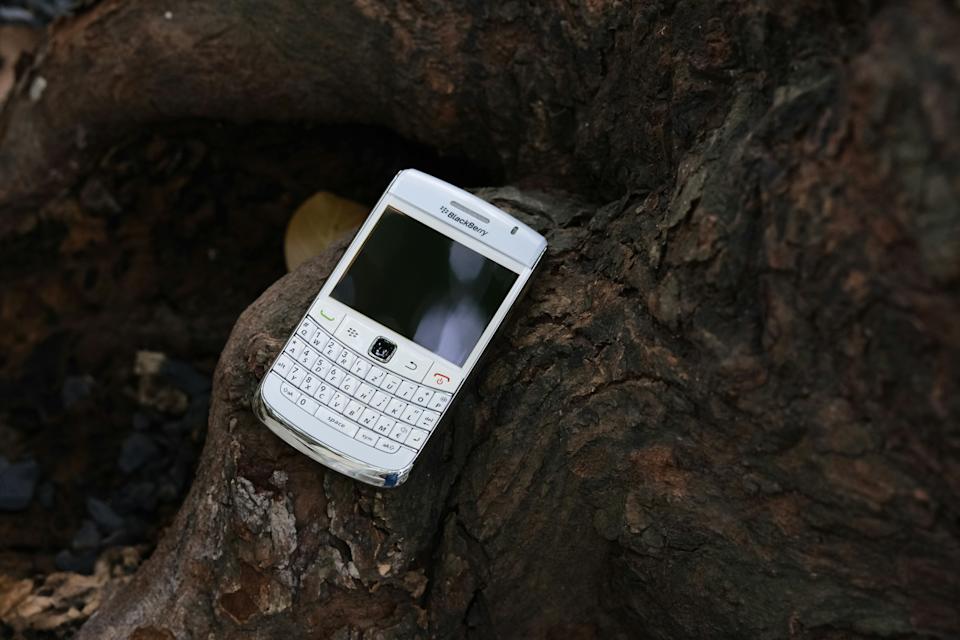
The physical smartphone keyboard (2007 plus change)

A BlackBerry on a rock.

Unsplash / Thai Nguyen

When the iPhone’s capacitive screen and touch keyboard landed, there was a learning curve. Moving from physical keys (whether it was a 9-key alphanumeric version or the BlackBerry’s QWERTY experience) to a touch screen, especially on the tiny 3.5-inch panel of the first iPhone, wasn’t easy.

But it was the future. Physical keyboards took up physical space on devices — especially as those screens grew and grew. The adoption of touch keyboards sped up, thanks to third-party keyboard apps on Android, like Swype, SwiftKey and many others, introducing different input methods, smarter predictive text, typing algorithms and even touch heatmaps. Software keyboards were intrinsically more versatile, supporting multiple languages, infinite key arrangements and eventually emoji galleries. A colon-ellipsis smiley soon didn’t hit the same.

The death of the disk drive, part 2 (2008)

The MacBook Air, introduced by Steve Jobs in 2008, was famously pulled from a manila envelope to demonstrate its ultraportable design. To achieve that slimness, it had to ditch the internal optical drive entirely, making it the first MacBook without one. That move kickstarted an era of ultraportable laptops.

It was a major break from what laptop users were used to, and Apple tried to offer people some options. Apple introduced “Remote Disc,” a feature which allowed the Air to wirelessly use the optical drive of a nearby Mac or PC, and offered an external USB SuperDrive as an optional accessory. (I’ve used mine exactly once since I bought it in 2013.)

While it was considered underpowered compared to Windows competitors, the original MacBook Air set a new design standard for the industry. It positioned Apple’s Macs for a future of App Store software installations, faster internet connectivity, and the rise of streaming media, cloud storage, and the rest. Apple’s MacBook Pro and MacBooks eventually followed suit, ditching optical drives in 2012.

Adobe Flash (2010)

Thoughts on Flash

Apple

In the early days of the iPhone, Apple famously refused to support Adobe Flash. This was in the early 2000s, too, when much of the web was built with Flash for animations and video support. The iPhone and iPad notably lacked support, creating a fractured browsing experience for years.

In April 2010, just as the first iPad arrived, Steve Jobs published his “Thoughts on Flash” open letter, criticizing its poor security and a lack of touch-friendliness. Many Flash games and interfaces interacted with the mouse cursor’s precise position, something that was invisible on the touchscreen iPhone.

It was also a calculated move. By denying Adobe access to the rapidly growing iOS user base, Apple forced developers to choose between sticking with the aging Flash or embracing open standards like HTML5. Also, by making Flash-based games and tools incompatible, it nudged those developers (and iPhone users) toward the App Store for those very games and tools (and more). There, Apple could curate and monetize those creations.

It was a slow death: Adobe finally discontinued Flash in 2020.

The headphone jack (2016)

Leszek Kobusinski / Alamy

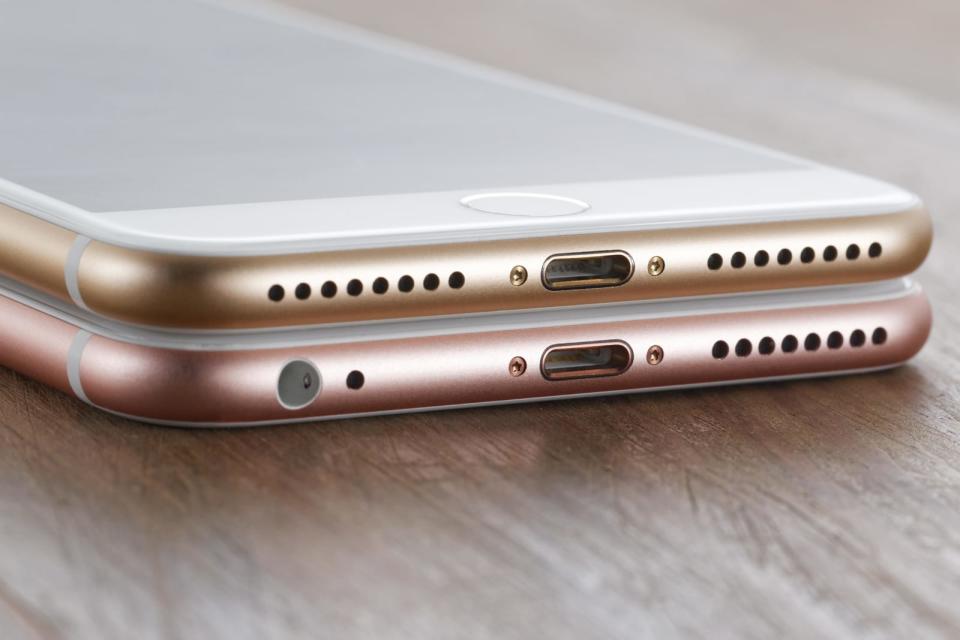
In a move described by Apple marketing executive Phil Schiller as “courage,” nixing the headphone socket ended up becoming the biggest headline to come from the iPhone 7 launch in 2016. Every flagship iPhone since has lacked the jack, with the most recent iPhone to include it being the original iPhone SE.

To make the change more palatable, Apple bundled a Lightning-to-3.5mm adapter (expect more dongle chat later) with the iPhone 7, 8 and X. In-box headphones also swapped from the typical jack to Lightning. Naturally, this meant you couldn’t charge the phone while you listened to music, unless you already had a pair of wireless headphones.

Of course, this move was ultimately instrumental in making true wireless earbuds ubiquitous. While Apple wasn’t remotely the first company to introduce wireless earbuds (and then headphones), the removal of the headphone jack undoubtedly sped up adoption. Pour one out for the Bragi Dash, the Jabras, the Jaybirds of this world.

Conveniently, alongside the aforementioned iPhone 7, Apple announced the AirPods. Features like one-tap setup and automatic pairing brought the convenience people expected of Apple and put it into a tiny white case.

Despite early resistance and “bragging” from rivals who clung onto the headphone jack, at this point, the socket is mostly confined to cheaper smartphones or phones aimed at audiophiles (hi, Sony) or mobile gamers (ASUS ROG).

Eventually, the iPad Pro also lost its headphone jack, and the rest of the company’s tablets followed. The only non-Mac device to keep the jack? The iPod Touch, which had one until its discontinuation in 2022.

Bespoke ports (2016)

MacBook Pro dongles

Engadget

2016 was the year of donglegate. Apple’s MacBook Pro redesign that year was another drastic shift in the laptop’s history. Chasing ever-thinner profiles and less port fuss, Apple stripped away nearly every legacy connector that professionals relied on. This was particularly jarring after the previous-generation MacBook Pro (2015) was often cited as the peak of utility, with a MagSafe charging port, two Thunderbolt 2 ports, two USB-A ports, not to mention a full-size HDMI port and an SD card slot.

Those were replaced with four (or on the cheapest 13-inch MBP only two!) Thunderbolt 3 USB-C ports and a headphone jack. For power users (like some Engadget editors), it demanded dongles (possibly multiple ones) in order to connect your USB-A thumb drive, wired internet, SD cards, external screens and well, at that point, pretty much everything. Many were particularly furious with the loss of the MagSafe charging connector. Of course, this also meant that one of those USB-C ports would be used primarily to charge the MBP. This sped up the availability of USB-C peripherals and accessories — perhaps because everyone was sick of carrying around so many dongles and hubs — but we still have USB-A devices. HDMI is everywhere. I still have SD Cards.

Eventually, Apple course-corrected itself. The 2021 MacBook Pro redesign reintroduced the SD card reader and HDMI port, and even MagSafe returned, freeing up a USB-C port.


Source link

Leave a Reply

Subscribe to Our Newsletter

Get our latest articles delivered straight to your inbox. No spam, we promise.

Recent Reviews


Alteryx Tools – Table of Content

What is Power BI?  

Power BI is referred to as a Software as a service (SaaS) platform, a Business Intelligence tool that helps analyze organizational data and also helps in creating real-time and interactive dashboards. The Power BI business intelligence tool can be installed on any desktop, mobile or can be used online as well. It also helps in collaborating with every peer in the organization. Power BI is a data visualization tool that helps in developing dashboards and BI reports with business intelligence capabilities. Apart from data visualization, it also allows to perform data exploration, helps in establishing reliable and secure connections to the cloud data sources.

Power BI is used by many organizations because of its amazing features like visualization creation. Some of the visualization formats are column charts, area plots, bar charts, line plots, scatter plots, pie charts, treemaps, scatter plots, etc. It also includes a navigation pane that helps in navigating to the dashboards and reports, associated applications, recent work, etc. The Power BI tool also includes inbuilt functions called DAX functions that can be used for data analysis. These are predefined functions that are available in the library. In Power BI, the data can be imported either from a single or multiple data sources. Power BI is also capable of providing extensive support to both structured and unstructured data. It also includes pre-built templates for dashboard creation. You can also create customized dashboards. 

What is Python?

Python is referred to as a high-level, general-purpose, interpreted programming language that includes a set of pre-built functions and libraries which helps in performing complex operations and calculations. It is easy to learn and is used in most fields like data analytics, artificial intelligence, machine learning, etc. 

Python includes two libraries called Matplotlib and Pandas. Matplotlib library consists of the predefined functions that help in plotting the data visualizations while the pandas library also includes the predefined functions that help in working with the data available.

Become a Power BI Certified professional by learning this HKR Power BI Training !

Power BI Training

  • Master Your Craft
  • Lifetime LMS & Faculty Access
  • 24/7 online expert support
  • Real-world & Project Based Learning

Prerequisites for Power BI Python Integration:

Below is the list of the prerequisites required for Power BI Python Integration to take place.

  1. Python runtime installation: The python runtime installation includes the installation of the execution run time through which the Python script operations can be performed.
  2. Libraries installation: It is essential that some of the important libraries have to be installed which increases the robustness of Power BI. Some of the important libraries are Seaborn and Pandas.
  3. Installation of Visual Studio Code: The installation of Visual Studio code is optional. You can also install any other code editor for writing your python scripts. You can also make use of the Power BI script editor to write the scripts.
  4. Power BI settings update: The final step is to update the settings so that you can work efficiently with Python in Power BI. Through this, you can perform the scripting in Power BI. All you need to do is open up the Power BI desktop, click on the file option. Then click on options followed by settings, then navigate to the opportunities which open a new dialogue box in Power BI. Then you can click on the Python scripting, select the path from the directories and IDE of Python. Once done, you will need to click on the OK button.

Understanding the need for Python Integration in Power BI:

By now, you all might have got an idea of what Power BI and Python is for. Yes, Python is referred to as the powerful tool that helps in creating visualizations while Power BI is for creating well-versed dashboards. These dashboards include all the information which helps in providing a complete view of the organization growth, metrics, KPIs, etc. Hence, if Python and Power BI are integrated, it will be a plus for us to utilize the capabilities that Power BI and Python hold.

Apart from the above, Python and Power BI integration includes several other benefits listed below.

  • The users are allowed to run the python scripts directly within the Power BI
  • Through the integration, libraries like Matplotlib and Seaborn can be used in Power BI for data visualization.
  • Python has become a leading technology and all the machine learning frameworks and data science libraries are written in Python. Through the integration, it allows to create of the data analysis scripts using Power BI
  • To perform precise calculations and clear the complexities, some of the enriched libraries like NumPy and Pandas can be used.

Click here to learn Power BI Tutorial

Power BI Python Integration:

In order to solve complex problems in an organization, it requires data and analytics. It also requires future predictions which gives us future insights and helps us clear the bypass of the issues. Through the business intelligence tools, all these predictions and data visualizations are represented in different forms for a better understanding and analysis. With the amazing capabilities that Power BI and Python hold, organizations are being successful with their integration attaining benefits.

Any idea on how the Power BI Python Integration is performed? Well, I will help with the step by step process to perform the Power BI Python integration.

  • Setup the Integrated Environment:

The primary step is to set up an integrated environment ready for the integration process to begin. You will need to have a distribution of Python readily installed in your machine/desktop. I preferred Anaconda for coding related tasks and the base distribution of Python. Sometimes, trying to integrate Anaconda with Power BI is a difficult task.

After the installation process is completed, you will need to install four python packages, each one has its own significance. They are :

Pandas – for data analysis and data manipulation

Matplotlib and seaborn – for plotting purposes

NumPy – for performing scientific calculations

The pip command in the command line tool is used for installing these packages into the machine.

pip install pandas

pip install matplotlib

pip install NumPy

pip install seaborn

Once the above packages are installed, the python scripting needs to be enabled in Power BI. If you want to check, you can open the Power BI and detect whether the python distribution is automatically detected or not. You will need to go to the files, followed by options and settings, then click on options. You will be able to view the home directory for Python under python scripting that is installed in the machine.

Setup the Integrated Environment

Acquire Vagrant certification by enrolling in the HKR Vagrant Training program in Hyderabad!

  • HKR Trainings Logo

    Subscribe to our YouTube channel to get new updates..!

  • Data Importing using the Python script:

It is time for you to check whether Python is working within Power BI by running a sample test. The primary step to perform this function is to import a small dataset using the Python script in Power BI.

To perform this, you will need to navigate to the Home ribbon, then move to the GetData option and click on the other option. Through this, you will be able to import the data from a different set of sources available. Some of the sources are Spark, Hadoop distributed file system, (HDFS), Web, etc. In the below image, I am going to import the Churn Prediction system that is available in my system.

Data Importing using the Python

Once you click on the connect option, you will see a section that allows you to write the Python script.

Python script

You will need to click on the OK button which will further ask you to select the churn data. Once done, you will need to click on the Load option. You can also perform a check whether the data has been loaded or not through the data view option. With this, you are now ready to make use of the power query in order to perform the data transformations.

Using Power Query To Transform the data:

All the individuals who have learned Python would know that data transformation is no longer a single task-based activity.

By using the Power Query editor, the user can shape and transform the data as required with just a single click. The Power BI is also capable of keeping the record of all the transformations and operations that take place or happen during the process of transformation. We will now show you how to use the Power query to understand and know the data transformation capabilities.

Once the data is loaded in the Power BI, you will need to click on the transform data option which is available under the Home tab in order to open the query editor.

Once the query editor is opened up, you will see multiple options to perform the operations like clean, reshape and transform the data.

Power Query To Transform

We will now convert the customer_nw_category variable into a text field because these fields represent the worth category. Also, you need to know that it would not be a continuous variable.

To perform the same, you will need to select the column -> Go to the Data Type, and change the data type to a text format. All the steps will be recorded by the Power query under the applied steps section. You can also rename these steps for a better recall or reference. I will rename this step as nw_cat Text. The next step is to transform the churn column into a logical variable. True here represents for churned (1), whereas False here represents not churned (2). The step can be renamed as Churn True/False.

customer_nw_category

Once the above operation is performed, you will need to click on the close and apply option which will be available on the top left corner so that all the transformations made will be applied.

Using Python’s Statistical within Power BI:

Power BI is considered a library of visualization. Correlation matrix heatmap is an integral component in the data analysis reports.

We will guide you on how to create a correlation matrix heatmap by making use of the Python correlation function. The created heatmap will be available in the reports section in Power BI.

You will need to navigate to the Report section that is available in the Power BI. Then click on the Py symbol which denotes Python visual which is available under the visualizations section. On the left side, you will see an empty Py along with a Python script editor popping up at the bottom of the screen. By this, you might have understood that Power BI is providing an option to create the visualizations with the scripts.

All the value fields will be empty firstly. For correlation heatmap illustration, all the continuous variables will be brought into the value fields, like the age current, previous month balance, monthly balance items, etc. This is considered one of the most essential steps during the integration process. If you forget to perform this step, the Power BI will not be able to recognize the variables.

As the variables are moved into the values fields, the python script will be automatically populated with the below codes.

Let us also write the code for correlation heatmap creation in Python by using the seaborn package.

# import the charting libraries matplotlib and seaborn

import matplotlib.pyplot as plt

import seaborn as sns

# create the correlation matrix on the dataset

corr = dataset.corr()

# create a heatmap of the correlation matrix

sns.heatmap(corr, cmap="YlGnBu")

# show plot

plt.show()

You can now use the run script button and run the script, which will produce a correlation matrix heatmap.

Python’s Statistical within Power BI

Generating analytical reports:

After the heatmap is generated, we can analyze the heatmap and will come to a conclusion.

With the above heatmap, below are the set of conclusions made:

  1. There is no correlation with the other variables for the number of dependents and age.
  2. There is a moderate correlation observed for the average monthly balance in the time span of the last two quarters.
  3. There is a high correlation between the average monthly balance with the previous month balance and the current month balance in the last quarter.
    It is possible to generate a heatmap for the customers who have churned and you can also compare with the customers that do not have. You can apply the filter of churn = False or True so that the heatmap can be observed. Through the analysis, it helps in deriving useful insights from data analysis to the prediction of the behavior.
  4. Power BI Training

    Weekday / Weekend Batches

Conclusion:

Through this article, you have got a clear idea of the process of integration of Python with Power BI. I hope the above information helps you. To get a clear understanding and in-depth knowledge on the subject, you can get trained and certified in Power BI through the Power BI training. The integrated environment will definitely help the organizations to handle and play with the data as and when needed. It focuses on enhancing the power and capitalizing on the benefits that are available in both tools.

related articles 


Source link