Portable, professional and plenty of polish


Way back in 2017, Roland carved out a little niche for itself with the introduction of the Go:Mixer line. The small, portable audio interfaces are a convenient way to connect a mic and multiple musical instruments (or audio sources) to your phone for more professional public performances or on-the-go recording. At this year’s NAMM show, the company unveiled the latest in the family — the Go:Mixer Studio — and it’s the most premium version to date.

The Studio adds a display, multitrack output and onboard effects along with a far more luxurious design. At $300, there’s also a far more luxurious price tag. The Go:Mixer Pro-X was already a capable option, and competing products from Mackie and Zoom are also vying for your hard-earned musical dollars. The big question, then, is can the Studio make a case for itself at this elevated price point?
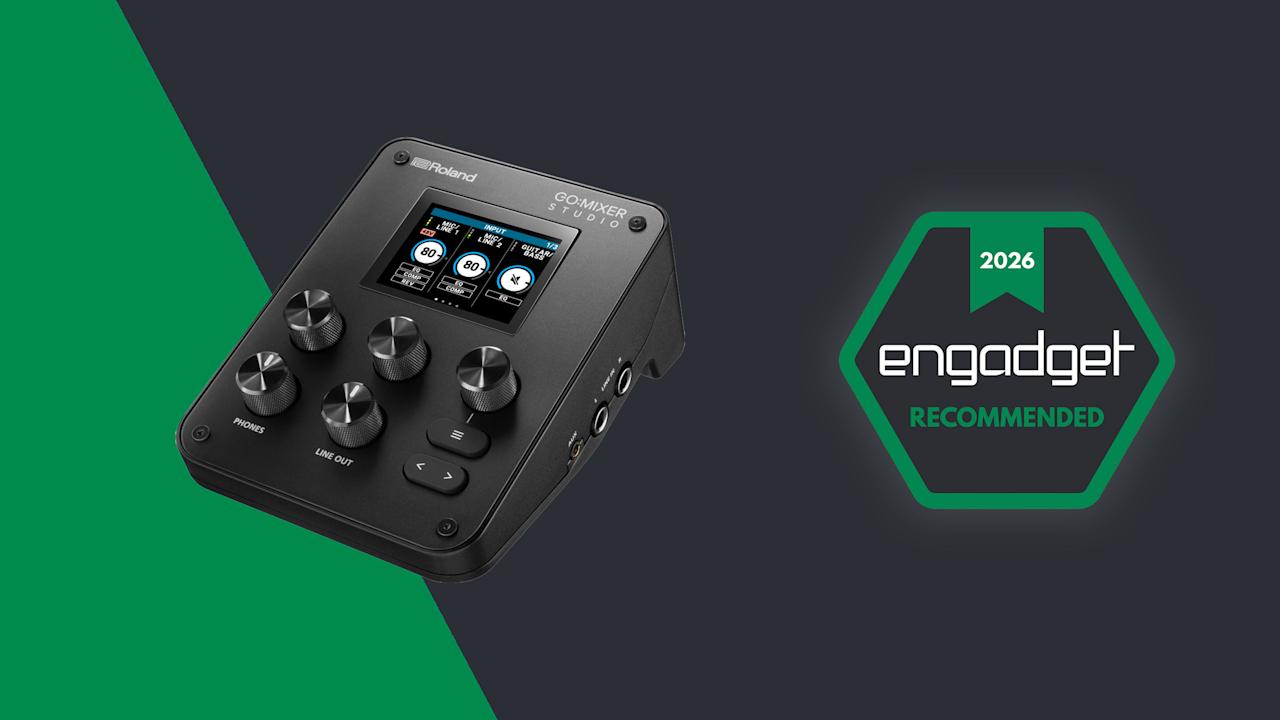
Image for the large product module

Roland/Engadget

Roland’s latest portable mixer for musicians is a step forward for those looking for a more premium option to bring with them on the go. The fact that it makes a good desktop interface expands its utility in a meaningful way that helps justify the $300 price tag.

Pros

  • Onboard display
  • Excellent connectivity
  • Easy menu navigation
  • Useful companion apps
Cons

  • No onboard storage
  • Apps lack streaming options

Right off the bat, in terms of usefulness, the Studio is a solid step up from the Pro-X thanks to the addition of a second XLR port. So if your band is a duo, or you simply need two microphones, each performer can now have their own. This also opens the Studio up for basic podcast situations, too. Technically, you could always connect more microphones through other inputs, but now you can do so without adapters or additional hardware like preamps. The rest of the connectivity remains similar with ¼-inch line-in and guitar ports, headset mic support, a 3.5mm aux input and USB-C for audio from your phone and connecting to the app.

Other headline upgrades include a much higher maximum sample rate of 24bit/192kHz (the Pro-X capped out at 16bit/48kHz) and there’s MIDI connectivity for the first time in the Go:Mixer series. The new effects consist of a compressor, EQ and reverb. EQ and compression are available at the channel level, allowing for a good amount of creative control over your mix, while reverb is global. There’s a decent selection of different types of reverb, too, with enough controls to configure them to your taste. I found some of them to be a bit robotic, or not very musical, but others sounded more traditional and appropriate for my vocals and synthesizers.

The Go:Mixer series was doing just fine without a display up until this point, but the benefits of having one are instantly clear. On the Pro-X, the only visual feedback for your levels was a solitary LED that indicated your audio was in the red. If you had multiple inputs, you might not even know which one was too loud. The first benefit of the Studio’s display, then, is visible VU meters. They’re not huge, and the display only shows information for three tracks at a time. This means you might have to page through a few screens to see the one you want, but it’s infinitely more useful than before.

The next obvious advantage of the screen is being able to control settings on the device via a menu. Navigation is intuitive, with the screen divided into three sections, corresponding to the three knobs just below it. The default screen, for example, shows the channels Mic 1, Mic 2 and Guitar/Bass. Turn the first knob clockwise to change the gain of Mic 1. The second knob for Mic 2 and so on. Click a knob and, where applicable, you’ll enter a sub-menu where those three dials control whatever is shown above them. This dynamic system works pretty well and took seconds before it felt natural.

The main limitation is that you can only see three of the mixer channels on screen at a time and there’s no way to manually reorder them. If you have a microphone connected and USB audio playing at the same time, you can’t see the levels or control both of those things from the same screen. You have to keep paging screens back and forth.

The good news is that Roland’s Go:Mixer Cam mobile app does offer a visual mixer that lets you see more or less every channel on screen at once and adjust levels quickly that way. It’s primarily designed for creating videos of your performance, but it doubles as a remote mixer if needed. There is one caveat with the app, though, which is that you won’t be able to use your phone as a USB audio source — say, for backing tracks — if you want to record video with the Go:Mixer Cam app. That’s something to be mindful of.

Roland 's Go:Mixer Studio has a display for the first time in the series

Roland ‘s Go:Mixer Studio has a display for the first time in the series (James Trew for Engadget)

The app does have a cool feature, which could also be a lifesaver: You can change the “mix” after recording. If you record a performance, but find that your vocals are a bit low, or your synth is too high in the mix, you can adjust the levels and re-export it with better balance. You have options to export as video or audio only, so you can share one to YouTube and then a version for Soundcloud all from the same app. Small detail, but if you want to use the app and have the mixer sample rate set to something other than 48kHz, it’ll warn you that it needs to revert to 48kHz and restart the device before you can carry on.

If you prefer recording on the desktop, there’s also a GoMixer Editor app for Windows and Mac. It’s actually a much easier way to change settings and see what’s going on thanks to the extra visual real estate. The EQ section for each channel looks like a regular software EQ where you raise or lower points on a frequency chart. The compressor also has visual feedback to show when it’s active, which is lacking on the device itself. Obviously, the Studio has a mobile focus, but the desktop app has two big selling points.

First, if you prefer to set your mix levels, compression amount and so on at home, you can do that more easily with the desktop app and then save it in a memory slot. You can then quickly recall this “Scene” on the device while out at a gig. The second is that, for the first time in the series (according to me at least), the Studio is a viable mixer and audio interface for the desktop. The build quality is solid and weighty, not like the light plastic of previous models. It feels premium and this could just as well be used at home for streaming and podcasting as much as on the go. The desktop app makes it even more useful in this scenario.

In terms of what’s missing, this might be very use-case specific. I enjoy using this for electronic music production or pseudo DJ type performances. As such, I’d love to see at least one fader rather than just knobs, but this is true of every model to date. I’d also love for there to be a way to see all the channels at once on the device’s screen. I know it’d be a bit cramped and there’d be no easy way to adjust the mix at the same time, but as an overview you could drop into, it might be handy. And if we’re out here making wishes for any Studio Pro model, an SD card slot for native recording would really elevate the portability element so you wouldn’t need to connect a phone, just a power bank.

The Go:Mixer Studio has two XLR inputs

The Go:Mixer Studio has two XLR inputs (James Trew for Engadget)

Roland has a few competitors in this space, most notably IK Multemida which makes a few portable interfaces. Perhaps the most similar is the iRig Pro Duo and Quattro. The Duo comes in a little cheaper than the Studio at around $235 but lacks a display and build quality. I also personally find IK Multimedia’s apps, while functional, less user friendly. Mackie has the M Caster Studio ($200) which adds Bluetooth connectivity but has fewer physical ports — that one too is a little older. Zoom’s interfaces often center on their ability to record directly onto the device, but have more of a vocal/spoken word focus. The H5 Studio ($299) has a display, built-in mic and onboard recording, but its mixer functionality and outputs for live performance are secondary features.

For musical performers, Roland continues to dominate this niche, and the Go:Mixer Studio is clearly the company’s most refined interface to date. The connectivity covers most use cases, even podcasting, and the layout of the dials makes it easy to use in live environments. The display is a welcome addition that goes a long way to making this feel both more useful and more premium. Perhaps the biggest selling point this time around is that the Studio no longer feels like an extra interface you bring with you for live gigs. It can easily be your main desktop audio interface too, making that $300 price tag suddenly feel a lot more palatable.


Source link

Leave a Reply

Subscribe to Our Newsletter

Get our latest articles delivered straight to your inbox. No spam, we promise.

Recent Reviews


PowerBI with SQL Server- Table of Content

What is Power BI?

Power BI is indeed a set of software tools, applications, and interfaces which works together to transform disparate data sources into logical, visualizations, and engaging information. The information could be in the form of an Excel spreadsheet or even a set of blended data warehouses which are both cloud-based and on-premises. Power BI makes it simple to link to various data sources, display and uncover what matters, and share your findings with whomever you choose.

  Become a Power BI Certified professional by learning this HKR Power BI Training !

Power BI’s elements:

Beginning with the three fundamentals, Power BI is made up of various components working together:

  • Power BI Desktop for Windows is a desktop app.
  • The Power BI service is a cloud-based SaaS (Software as a Service) application.
  • In iOS, Windows, & Android smartphones, there are Power BI mobile apps.

Power BI Desktop, the platform, as well as the mobile applications, are all intended to help you generate, distribute, and utilize market intelligence in the most efficient way possible.Apart from them, Power BI has two more characteristics: the Power BI Report Builder, which allows you to create paginated reports that you can distribute through the Power BI service, and the Power BI Data Warehouse. On-premises data server powered by Power BI. After developing your Power BI reports in Power BI Desktop, you may upload them to Power BI Report Server, a report server.Power BI's elements

The Benefits of Power BI

Power BI has a number of features that set it apart from other analytical tools:

  • It has both a cloud-based and a desktop interface.
  • Data warehousing, analytic tools, and interactive dashboards are some of the features available.
  • Customized visualizations can be loaded.
  • It’s simple to scale throughout the entire company.

Become a Sisense Certified professional by learning this HKR Sisense Training

What is SQL Server?

SQL (Structured Query Language) is a crucial skill in the field of data science, and it’s quite simple to master. Most people, however, overlook the fact that SQL is more than just generating queries, but that’s only the first step. It’s a different matter to ensure that inquiries are efficient or even that they match the environment in which you’re working.

Microsoft’s SQL Server is a relational database management system (RDBMS). It was created largely to compete with the MySQL and Oracle databases. The standard SQL language is supported by SQL Server. T-SQL, SQL Server’s own version of a SQL language, is included (Transact-SQL).  T-SQL stands for Transact-SQL, a Microsoft proprietary language. It also has the ability to declare variables, handle exceptions, and run stored procedures, among other things. Another important interface tool for SQL Server is SQL Server Management Studio (SSMS), which works in both 32-bit and 64-bit settings.

SQL Server helps to run several services at the same time, each with its own ports, logins, databases, and so on. These are separated into two categories:

  • Primary Instance.
  • Instances with a Name

There are two methods for gaining access to the primary instance. We can start with the server name. We can also utilize its IP address. By attaching a backslash and the instance name, you can access named instances.

Is SQL important for Power BI?

Power BI Desktop’s ability to conduct T-SQL queries gives you useful resources for retrieving SQL Server data. Perhaps you’ll be able to get the most out of the SQL Server query engine, and you’ll also be able to reduce the amount of the datasets are imported into Power BI Desktop and the number of modifications you have to do.

To take this technique, you’ll need to know how to utilize T-SQL, and if you do or can find someone who does, you’ll have a lot of flexibility when dealing with SQL Server data. Even if you extract data table by table, you still have a variety of powerful tools for interacting with SQL Server data & organizing it for use in Power BI visualizations. Whereas the Power BI service allows you to retrieve data from a variety of sources, it will not have a SQL Server data connector. One could export SQL Server files and then import them into the service, but you can’t connect immediately from service to SQL Server, regardless of the fact that SQL Server seems to play a crucial role in many organizations today. The more you know about importing and transforming SQL Server data in Power BI Desktop, the better.

Prerequisites to connect Power BI To SQL Server

  • Before you begin, join up for the free trial of Power BI, in case you do not even already have one.
  • On the local computer, install the Power BI Desktop.
  • Download SQL Server within a local computer and recover a backup of the demo database.
  • In the local computer as SQL Server, install the data gateway.
  • Consult a network administrator in the organization if you aren’t a network administrator and wouldn’t want to set up a gateway yourself. They’ll be capable of creating the data source configuration needed to link your dataset to the SQL Server database. Import Data connectivity mode must be used if you’re going to employ a saved procedure.

Step by Step approach to Connect Power BI to SQL Server

1. Power BI Desktop and installation

Power BI Desktop seems to be a free tool that you can download and install on your computer. It may link to a variety of data sources. Normally, an analytical project starts with report development in Power BI Desktop. The data is subsequently uploaded to the Power BI service, where it may be associated with the Power BI Mobile applications, allowing users to access the reports on their mobile devices.

Power BI Desktop and installation

Installation

Power BI is only available on Windows computers. Users on Macs may either create a Windows VM on Azure and install Power BI there, including using Turbo.net, that could broadcast Power BI instantly towards the Mac from either the cloud.

There are two ways to use Power BI:

  • We can download this from the Microsoft Store as an application and simply login in and get going. This would be the device’s digital equivalent.
  • We often have to operate with the information in offline mode. In these kinds of cases, download the software first rather than install it locally. Take the time to read through the entire installation guide.

Download the application to the system, based on the products you’ve chosen. Check the installation via selecting the Power BI Symbol after approving the license agreement. If the screen below shows, you’re ready to begin.

Power BI Symbol

2. Workspace

Let’s have a look at how Power BI Desktop works now. We’ll have a look at it in another part to get an idea of how it works.

The graphic below depicts the key characteristics of Power BI’s workspace..

Workspace

Click here to learn Power BI Tutorial

Power BI Training

  • Master Your Craft
  • Lifetime LMS & Faculty Access
  • 24/7 online expert support
  • Real-world & Project Based Learning

3. Data Source

A variety of data sources could be connected to Power BI. The Get Data button toggles all of the data sources that may be used to import data into Power BI.

Data Source

4. Connecting to SQL Server

Let’s look at an example of connecting a SQL server dataset to Power BI Desktop and using that to examine the data.

Database Example

We’ll have to use a publically available SQL Server installation on AWS for the demonstration, as well as a database built from the Superstore dataset.

Our goal as Data Analysts would be to assess the data and identify significant areas of concern inside this hypothetical firm. 

Getting into the sample database

SQL Server Management Studio should be installed (SSMS). SSMS seems to be a free and fully integrated management environment for every SQL system. SSMS allows you to install, manage, and modify the data-tier components that your applications rely on, and also create inquiries and workflows.

After you’ve downloaded and installed the software, you’ll see the page below, which will prompt you for particular credentials.

Connecting to SQL Server

1. Insert the given information:

Server Name: ec2-52-14-205-70.us-east-2.compute.amazonaws.com

Authentication: SQL Server Authentication

Login: SQL

Password: SQL

The ‘SuperStoreUS’ database will indeed be accessible as a ‘Read Only’ user. As our sample, the instance is ec2–52–14–205–70.us-east

2. compute.amazonaws.com, the databases are SuperstoreUS and Test, and the tables inside the SuperstoreUS database are Customers, Orders, and so on. As a result, there could be lots of instances, each of which can have multiple databases, each of which would contain various tables.

SQL Server Authentication

5. Importing SQL data into Power BI

The data is organized into searches by Power BI Desktop. It implies that all of the information is organized in a table-like format.

Making the connection

Proceed to the start button by opening Power BI Desktop. The Get Data tab pane gives you a number of options when it comes to sources of data that could be linked to the Power BI Desktop. We’ll establish a connection to the SQL Server.

connection to the SQL Server

When you select SQL Server, a fresh screen will appear, asking again for the server with which we wish to connect our Power BI Desktop. Fill in the blanks, and you’re finished. We could now inspect the details of the selected table by clicking on it. For uploading a certain table, merely check the box beside it click the load button.

SQL Server

Modes of Data Connectivity

Power BI Desktop may link to a SQL database in two distinct ways, both of which display on the homepage.

Import

The import technique, as the title suggests, ‘imports’ the chosen tables onto Power BI Desktop. The imported data is therefore used by Power BI to create a visualisation or perform any adjustments. We must reload the data to view any modifications in the data, which re-imports the full data set.

DirectQuery

No information is incorporated or transferred to Power BI Desktop if DirectQuery is selected as an option. Power BI Desktop searches the fundamental data source while we generate or process the information through visualisations, ensuring that we’re still dealing with the most recent data. Nevertheless, unlike the importing method, this approach has restricted data processing capabilities.

Power BI Desktop

6. Query Editor

All of the chosen tables would be imported into Power BI Desktop & displayed in the Data view as distinct datasets. .

Query Editor

We can make changes to our datasets from here. We’ll use the Query Editor to accomplish this. The query generator could be used to edit datasets regardless of the data source. The query editor allows us to perform operations such as rebranding a dataset, eliminating a single or several columns, and so on.

 rebranding a dataset

The number of functional inquiries is displayed on the left pane, while the Query Settings pane on the right provides all of the stages related with a query.

Advanced  Editor

The script for the inquiry that has been run against the source of data is displayed in the Advanced Editor. The syntax is M, which stands for Power Query Formula Language. It is also possible to write your own code.

Make a backup of your work

Choose Close & Apply from the Query Editor’s File menu once you’ve made the appropriate data changes in the query editor. The adjustments will be applied to the data in Power BI Desktop.

data in Power BI Desktop

 Top 50 frequently asked Power BI Interview Questions !

Business Intelligence & Analytics, powerbi-with-sql-server-description-4, Business Intelligence & Analytics, powerbi-with-sql-server-description-14

Subscribe to our YouTube channel to get new updates..!

7. Merging Datasets

When we wish to integrate one or maybe more datasets into one, merging datasets proves useful. The Query Editor can also assist with this merger. We’ll pull multiple tables(3) from the SuperstoreUS database this time.  Customers, Orders, and Returns are the three tables.

Merging Datasets

The three specified tables are listed in the Fields column. Now, go to the Edit Queries option and click the Combine option from the dropdown menu, which will reveal the Merge option. We’ll use the merged existing queries to construct a new query.

Merge option

We pick the tables to be combined as well as the kind of join we need in the Merge dialogue box. Columns that are similar to both tables must be chosen.

Let’s start by creating a new query called Orders and Customers. Through this query, we’ll join the Orders and Customers tables. All of the key columns from the orders table, as well as correlation columns from either the customer’s table, were included in the new query. Except for the last one, which reflects the Customers query, eliminate all the correlation columns. Next, from the Customers query, choose columns to merge into the newly merged query.

Customers query

The merged query is composed of a single database that has all of the required columns. Rather than operating with several data sources, which might cause confusion, you could now easily interact with one single database.

8. Building & Publishing a Dashboard

We may begin the Dashboard construction process since we had the dataset prepared along with all the alterations completed. The Power BI dashboard often referred to as a canvas, is a single sheet that contains multiple visualizations that serve to convey a narrative. The reports’ visuals, known as tiles, are attached to the dashboard.

Now just to see what recommendations we can glean from the superstore data set.

  • States seeking profit
  • Profit & Sales by Segment

Building & Publishing a Dashboard

Region-by-Region Sales and Profit

Sub-Category Sales

Profits by location

Quantity

We’ll obtain a dashboard that looks like the one below after we’ve formatted the size, look, and colour.

dashboard

Publishing
Data would be only valuable if it can be transferred across individuals or groups. By publishing the Dashboard or reports to the Power BI Service, they can be shared with others. The Dashboards/Reports can then be seen or interacted with using the Power BI Apps.

Publishing

Power BI Training

Weekday / Weekend Batches

Conclusion:

When SQL and Power BI are combined, data analysis is carried out properly. We can integrate SQL Server to Power BI with ease and retrieve information right into it. Customers can switch connections with a single click in Power BI to execute in-memory searches to a bigger dataset. SQL is a handy tool that, when combined with Power BI’s expertise, may assist in monitoring and reporting more effectively and informative.

Related Articles:

  1. KPI in Power BI
  2. Looker vs Power BI
  3. MSBI vs Power BI


Source link