Oil prices are falling by more than 10 percent Friday, and Wall Street is rallying toward another record after Iran said the Strait of Hormuz is fully open, allowing oil tankers to exit the Persian Gulf again and carry crude to customers worldwide.
The S&P 500 climbed 0.8 percent as U.S. stocks run toward the finish of a third straight week of big gains, their longest such streak since Halloween. The Dow Jones Industrial Average was up 678 points, or 1.4 percent, as of 9:35 a.m. Eastern time, and the Nasdaq composite was 1 percnet higher.
The price for a barrel of benchmark U.S. crude tumbled 10.8 percent to $81.28.
Brent crude, the international standard, dropped 10.3 percent to $89.13. To be sure, it remains above its $70 level from before the war, indicating some caution is still embedded in financial markets.
Several times since the war began, optimism on Wall Street has quickly swung to doubt about a possible end to the fighting. That in turn has caused vicious and sudden swings of prices for everything from stocks to bonds to oil.
A strong start to the earnings reporting season for big U.S. companies has also helped to support the U.S. stock market, and several more financial companies joined the list Friday of companies delivering bigger profits for the start of 2026 than analysts expected.
State Street rose 2.9 percent, and Fifth Third Bancorp added 1.9 percent after both reported better results for the latest quarter than expected.
They helped offset an 11.5 percent drop for Netflix, which fell even though it likewise delivered a better profit than expected. It did not raise its forecast for revenue growth for the full year, which analysts said may have disappointed some investors. It also said Reed Hastings, cofounder and chairman of the streaming company, will step down from its board of directors in June when his term expires.
In stock markets abroad, stock indexes leaped in Europe following Iran’s announcement about the Strait of Hormuz. France’s CAC 40 jumped 2 percent, and Germany’s DAX returned 2.2 percent.
In Asia, where trading finished for the day before the announcement, indexes were weaker. Japan’s Nikkei 225 lost 1.8 percent, and Hong Kong’s Hang Seng fell 0.9 percent for two of the bigger losses.
In the bond market, Treasury yields eased sharply as falling oil prices took pressure off inflation. The yield on the 10-year Treasury dropped to 4.24 percent from 4.32 percent late Thursday.
Power BI is referred to as a Software as a service (SaaS) platform, a Business Intelligence tool that helps analyze organizational data and also helps in creating real-time and interactive dashboards. The Power BI business intelligence tool can be installed on any desktop, mobile or can be used online as well. It also helps in collaborating with every peer in the organization. Power BI is a data visualization tool that helps in developing dashboards and BI reports with business intelligence capabilities. Apart from data visualization, it also allows to perform data exploration, helps in establishing reliable and secure connections to the cloud data sources.
Power BI is used by many organizations because of its amazing features like visualization creation. Some of the visualization formats are column charts, area plots, bar charts, line plots, scatter plots, pie charts, treemaps, scatter plots, etc. It also includes a navigation pane that helps in navigating to the dashboards and reports, associated applications, recent work, etc. The Power BI tool also includes inbuilt functions called DAX functions that can be used for data analysis. These are predefined functions that are available in the library. In Power BI, the data can be imported either from a single or multiple data sources. Power BI is also capable of providing extensive support to both structured and unstructured data. It also includes pre-built templates for dashboard creation. You can also create customized dashboards.
What is Python?
Python is referred to as a high-level, general-purpose, interpreted programming language that includes a set of pre-built functions and libraries which helps in performing complex operations and calculations. It is easy to learn and is used in most fields like data analytics, artificial intelligence, machine learning, etc.
Python includes two libraries called Matplotlib and Pandas. Matplotlib library consists of the predefined functions that help in plotting the data visualizations while the pandas library also includes the predefined functions that help in working with the data available.
Become a Power BI Certified professional by learning this HKR Power BI Training !
Power BI Training
Master Your Craft
Lifetime LMS & Faculty Access
24/7 online expert support
Real-world & Project Based Learning
Prerequisites for Power BI Python Integration:
Below is the list of the prerequisites required for Power BI Python Integration to take place.
Python runtime installation: The python runtime installation includes the installation of the execution run time through which the Python script operations can be performed.
Libraries installation: It is essential that some of the important libraries have to be installed which increases the robustness of Power BI. Some of the important libraries are Seaborn and Pandas.
Installation of Visual Studio Code: The installation of Visual Studio code is optional. You can also install any other code editor for writing your python scripts. You can also make use of the Power BI script editor to write the scripts.
Power BI settings update: The final step is to update the settings so that you can work efficiently with Python in Power BI. Through this, you can perform the scripting in Power BI. All you need to do is open up the Power BI desktop, click on the file option. Then click on options followed by settings, then navigate to the opportunities which open a new dialogue box in Power BI. Then you can click on the Python scripting, select the path from the directories and IDE of Python. Once done, you will need to click on the OK button.
Understanding the need for Python Integration in Power BI:
By now, you all might have got an idea of what Power BI and Python is for. Yes, Python is referred to as the powerful tool that helps in creating visualizations while Power BI is for creating well-versed dashboards. These dashboards include all the information which helps in providing a complete view of the organization growth, metrics, KPIs, etc. Hence, if Python and Power BI are integrated, it will be a plus for us to utilize the capabilities that Power BI and Python hold.
Apart from the above, Python and Power BI integration includes several other benefits listed below.
The users are allowed to run the python scripts directly within the Power BI
Through the integration, libraries like Matplotlib and Seaborn can be used in Power BI for data visualization.
Python has become a leading technology and all the machine learning frameworks and data science libraries are written in Python. Through the integration, it allows to create of the data analysis scripts using Power BI
To perform precise calculations and clear the complexities, some of the enriched libraries like NumPy and Pandas can be used.
In order to solve complex problems in an organization, it requires data and analytics. It also requires future predictions which gives us future insights and helps us clear the bypass of the issues. Through the business intelligence tools, all these predictions and data visualizations are represented in different forms for a better understanding and analysis. With the amazing capabilities that Power BI and Python hold, organizations are being successful with their integration attaining benefits.
Any idea on how the Power BI Python Integration is performed? Well, I will help with the step by step process to perform the Power BI Python integration.
Setup the Integrated Environment:
The primary step is to set up an integrated environment ready for the integration process to begin. You will need to have a distribution of Python readily installed in your machine/desktop. I preferred Anaconda for coding related tasks and the base distribution of Python. Sometimes, trying to integrate Anaconda with Power BI is a difficult task.
After the installation process is completed, you will need to install four python packages, each one has its own significance. They are :
Pandas – for data analysis and data manipulation
Matplotlib and seaborn – for plotting purposes
NumPy – for performing scientific calculations
The pip command in the command line tool is used for installing these packages into the machine.
pip install pandas
pip install matplotlib
pip install NumPy
pip install seaborn
Once the above packages are installed, the python scripting needs to be enabled in Power BI. If you want to check, you can open the Power BI and detect whether the python distribution is automatically detected or not. You will need to go to the files, followed by options and settings, then click on options. You will be able to view the home directory for Python under python scripting that is installed in the machine.
Acquire Vagrant certification by enrolling in the HKR Vagrant Training program in Hyderabad!
Subscribe to our YouTube channel to get new updates..!
Data Importing using the Python script:
It is time for you to check whether Python is working within Power BI by running a sample test. The primary step to perform this function is to import a small dataset using the Python script in Power BI.
To perform this, you will need to navigate to the Home ribbon, then move to the GetData option and click on the other option. Through this, you will be able to import the data from a different set of sources available. Some of the sources are Spark, Hadoop distributed file system, (HDFS), Web, etc. In the below image, I am going to import the Churn Prediction system that is available in my system.
Once you click on the connect option, you will see a section that allows you to write the Python script.
You will need to click on the OK button which will further ask you to select the churn data. Once done, you will need to click on the Load option. You can also perform a check whether the data has been loaded or not through the data view option. With this, you are now ready to make use of the power query in order to perform the data transformations.
Using Power Query To Transform the data:
All the individuals who have learned Python would know that data transformation is no longer a single task-based activity.
By using the Power Query editor, the user can shape and transform the data as required with just a single click. The Power BI is also capable of keeping the record of all the transformations and operations that take place or happen during the process of transformation. We will now show you how to use the Power query to understand and know the data transformation capabilities.
Once the data is loaded in the Power BI, you will need to click on the transform data option which is available under the Home tab in order to open the query editor.
Once the query editor is opened up, you will see multiple options to perform the operations like clean, reshape and transform the data.
We will now convert the customer_nw_category variable into a text field because these fields represent the worth category. Also, you need to know that it would not be a continuous variable.
To perform the same, you will need to select the column -> Go to the Data Type, and change the data type to a text format. All the steps will be recorded by the Power query under the applied steps section. You can also rename these steps for a better recall or reference. I will rename this step as nw_cat Text. The next step is to transform the churn column into a logical variable. True here represents for churned (1), whereas False here represents not churned (2). The step can be renamed as Churn True/False.
Once the above operation is performed, you will need to click on the close and apply option which will be available on the top left corner so that all the transformations made will be applied.
Using Python’s Statistical within Power BI:
Power BI is considered a library of visualization. Correlation matrix heatmap is an integral component in the data analysis reports.
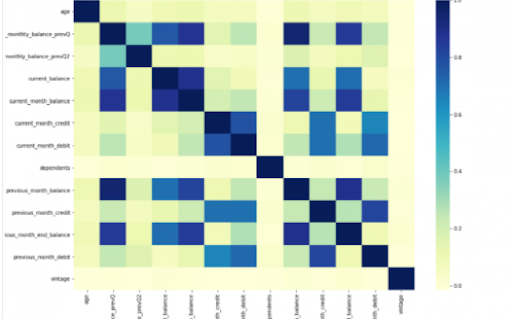
We will guide you on how to create a correlation matrix heatmap by making use of the Python correlation function. The created heatmap will be available in the reports section in Power BI.
You will need to navigate to the Report section that is available in the Power BI. Then click on the Py symbol which denotes Python visual which is available under the visualizations section. On the left side, you will see an empty Py along with a Python script editor popping up at the bottom of the screen. By this, you might have understood that Power BI is providing an option to create the visualizations with the scripts.
All the value fields will be empty firstly. For correlation heatmap illustration, all the continuous variables will be brought into the value fields, like the age current, previous month balance, monthly balance items, etc. This is considered one of the most essential steps during the integration process. If you forget to perform this step, the Power BI will not be able to recognize the variables.
As the variables are moved into the values fields, the python script will be automatically populated with the below codes.
Let us also write the code for correlation heatmap creation in Python by using the seaborn package.
# import the charting libraries matplotlib and seaborn
import matplotlib.pyplot as plt
import seaborn as sns
# create the correlation matrix on the dataset
corr = dataset.corr()
# create a heatmap of the correlation matrix
sns.heatmap(corr, cmap="YlGnBu")
# show plot
plt.show()
You can now use the run script button and run the script, which will produce a correlation matrix heatmap.
Generating analytical reports:
After the heatmap is generated, we can analyze the heatmap and will come to a conclusion.
With the above heatmap, below are the set of conclusions made:
There is no correlation with the other variables for the number of dependents and age.
There is a moderate correlation observed for the average monthly balance in the time span of the last two quarters.
There is a high correlation between the average monthly balance with the previous month balance and the current month balance in the last quarter. It is possible to generate a heatmap for the customers who have churned and you can also compare with the customers that do not have. You can apply the filter of churn = False or True so that the heatmap can be observed. Through the analysis, it helps in deriving useful insights from data analysis to the prediction of the behavior.
Power BI Training
Weekday / Weekend Batches
Conclusion:
Through this article, you have got a clear idea of the process of integration of Python with Power BI. I hope the above information helps you. To get a clear understanding and in-depth knowledge on the subject, you can get trained and certified in Power BI through the Power BI training. The integrated environment will definitely help the organizations to handle and play with the data as and when needed. It focuses on enhancing the power and capitalizing on the benefits that are available in both tools.
To provide the best experiences, we use technologies like cookies to store and/or access device information. Consenting to these technologies will allow us to process data such as browsing behavior or unique IDs on this site. Not consenting or withdrawing consent, may adversely affect certain features and functions.
Functional
Always active
The technical storage or access is strictly necessary for the legitimate purpose of enabling the use of a specific service explicitly requested by the subscriber or user, or for the sole purpose of carrying out the transmission of a communication over an electronic communications network.
Preferences
The technical storage or access is necessary for the legitimate purpose of storing preferences that are not requested by the subscriber or user.
Statistics
The technical storage or access that is used exclusively for statistical purposes.The technical storage or access that is used exclusively for anonymous statistical purposes. Without a subpoena, voluntary compliance on the part of your Internet Service Provider, or additional records from a third party, information stored or retrieved for this purpose alone cannot usually be used to identify you.
Marketing
The technical storage or access is required to create user profiles to send advertising, or to track the user on a website or across several websites for similar marketing purposes.