
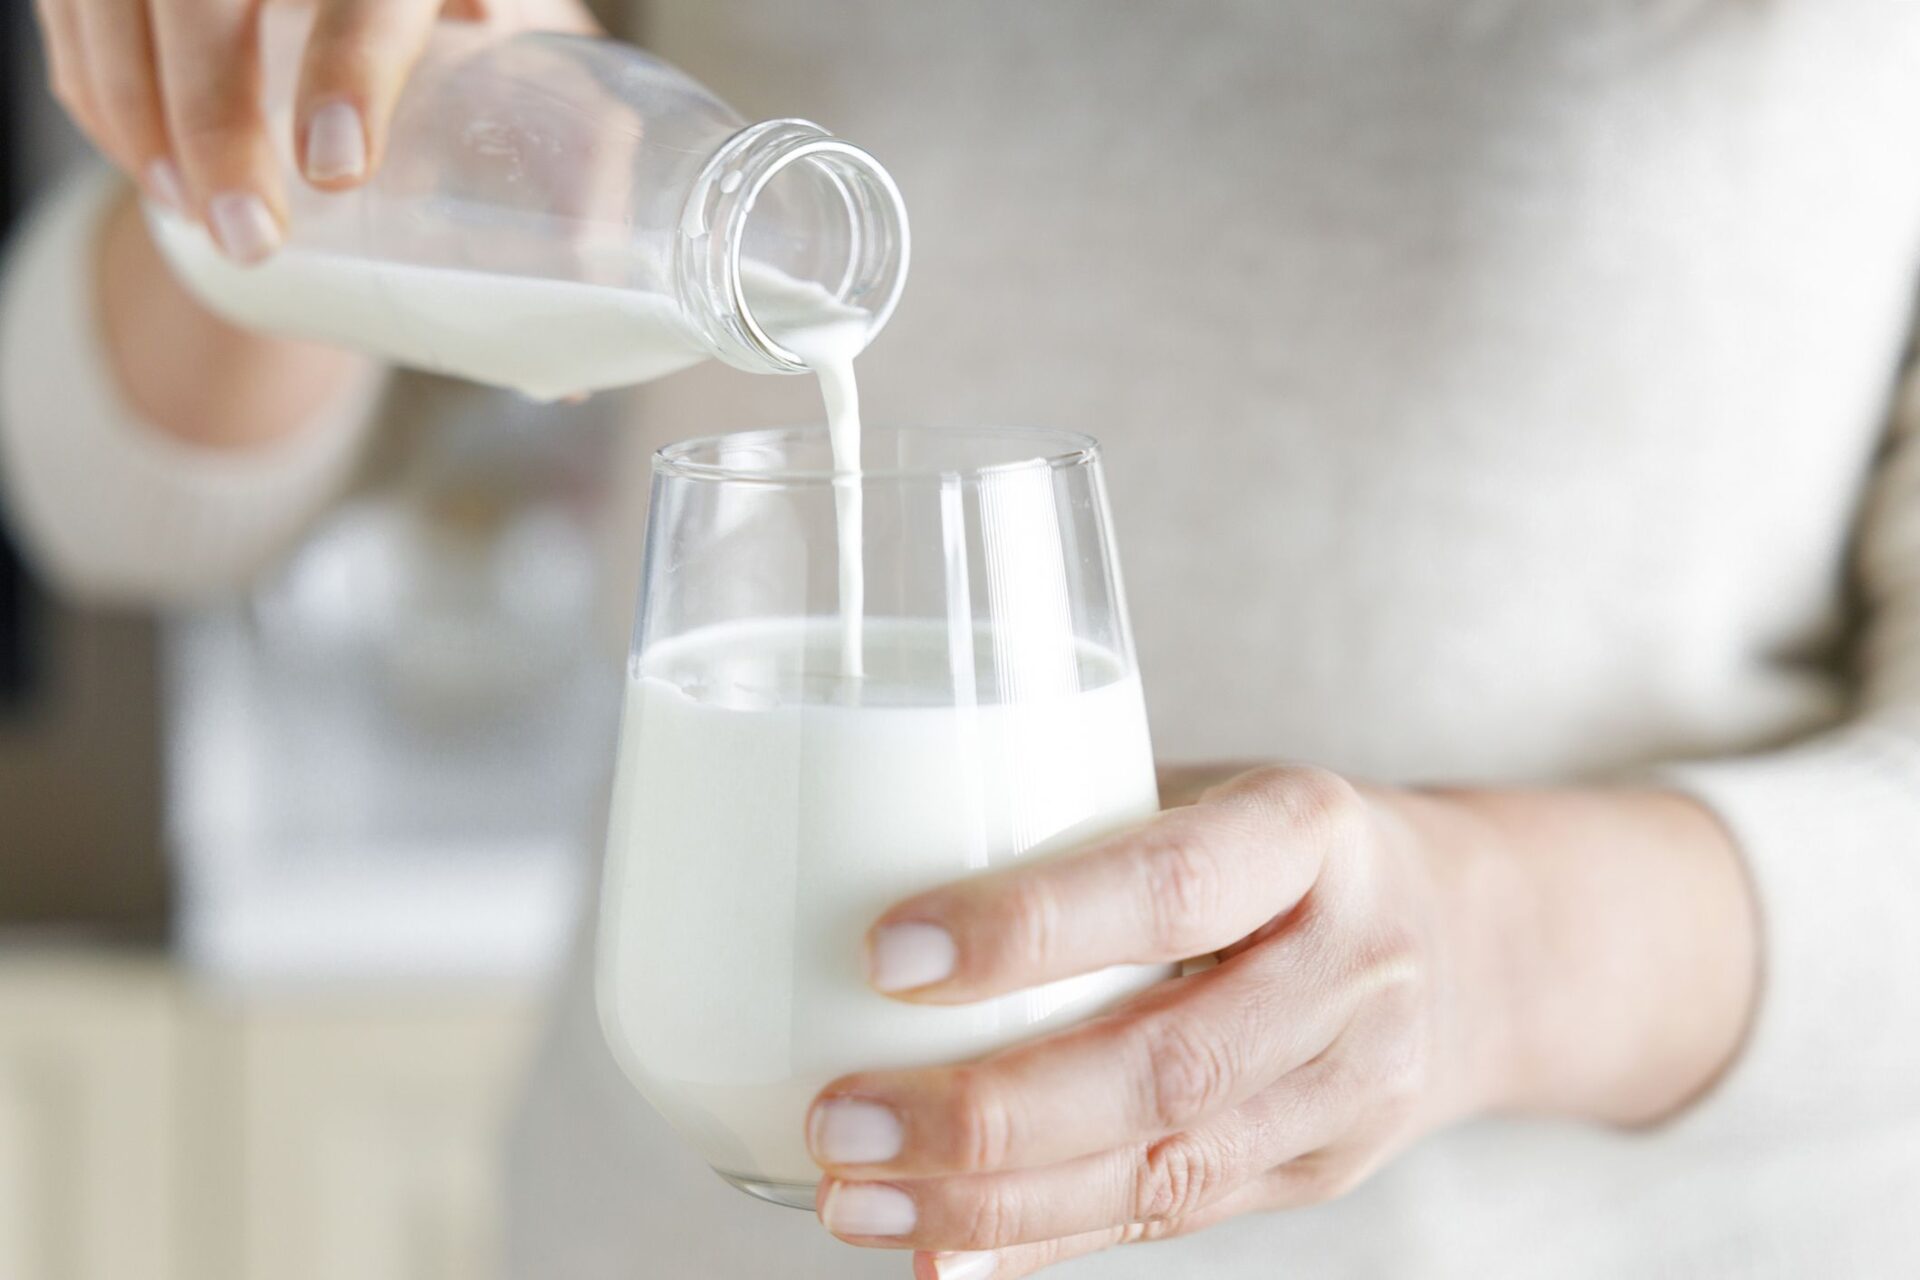
What Happens to Your Body When You Stop Having Dairy?


Credit: eternalcreative / Getty Images
  • Cutting out dairy can relieve lactose intolerance symptoms and may improve acne for some people.
  • Removing dairy without replacements can lower intake of calcium, vitamin D, and protein, which are important for bone health and overall nutrition.
  • Avoiding high-calorie dairy foods may support weight loss if it helps reduce total calorie intake.

Dairy products, like milk, ice cream, yogurt, and cheese, are an essential part of many people’s diets. However, in some cases, cutting out dairy may be helpful. For example, people with lactose intolerance and acne may find that their symptoms clear up after they stop having dairy. But, there may be some downsides to cutting out dairy, too. Here’s what happens to your body when you stop having dairy. 

1. Lactose Intolerance Symptoms Will Stop

Dairy products are made with cow’s milk, which contains lactose, a sugar that can cause digestive issues in many people.

Up to 75% of the world’s population is intolerant to lactose. In people with lactose intolerance, the body doesn’t produce enough of an enzyme called lactase, which is needed to break down lactose so it can be absorbed. 

People with lactose intolerance experience digestive symptoms such as bloating, gas, and diarrhea after consuming lactose-containing foods. Cutting out dairy products can stop lactose intolerance symptoms and may be a smart option for some people with this condition.

Keep in mind that many people with lactose intolerance can still enjoy small amounts of low-lactose dairy products, like yogurt and hard cheese, and don’t have to cut all dairy from their diets.  

2. Your Acne May Get Better

Studies show that people who consume dairy products, like milk, are more likely to have acne

This may be because people who consume high amounts of dairy tend to have elevated levels of hormones like insulin-like growth factor 1 (IGF-1) and insulin compared with nondairy consumers.

These hormones may worsen inflammation and oil production, triggering or worsening acne. Though dairy isn’t a trigger for everyone with acne, cutting it out may help improve acne symptoms in some people. 

If you currently consume dairy and have acne, try cutting out dairy for a month or so to see if your acne symptoms improve. Keep in mind that there are many factors that can trigger and worsen acne, such as diet, medications, genetics, and hormonal fluctuations. 

3. Your Calcium and Vitamin D Intake May Drop

Dairy is a primary source of calcium in the average American diet, accounting for around 40% of calcium intake. Fortified dairy products, like milk, are also a main source of vitamin D, with a cup of fortified milk providing 23% of the Daily Value (DV).

Calcium plays important roles in the body, including regulating nerve function and providing structure to bones and teeth, while vitamin D promotes calcium absorption, helps regulate inflammation, and supports immune function.

For example, studies show that consuming dairy protects bone health by increasing bone density, preventing bone loss,  and reducing the risk of fractures and osteoporosis, a disease that causes weak and brittle bones.

If you do cut out dairy, it's important to increase your intake of other dietary sources of calcium and vitamin D.

4. You May Lose Some Weight

If you’re overconsuming calories from dairy products, like cheese and whole milk, cutting out dairy could help you lose weight

While dairy intake has historically been linked to a healthier body weight, if you’re taking in more calories than you need from any source, even from nutritious foods like dairy, you’ll gain weight.

For example, if you’re drinking whole milk several times a day or frequently snacking on cheese, you could be taking in hundreds of extra calories. If you’re trying to lose weight, replacing high-calorie foods with lower-calorie foods can help you create a calorie deficit to promote weight loss. 

5. Your Protein Intake May Drop

Dairy products, like yogurt and cottage cheese, are excellent sources of protein. A serving of cottage cheese or yogurt packs over 23.5 grams of protein, making them a perfect snack or breakfast option for people looking to boost their protein intake.

Milk, cheese, and kefir also offer convenient and versatile sources of protein. Protein is essential for muscle health and also slows digestion and promotes the release of satiety hormones, helping you feel full after eating. Increasing your protein intake could also benefit blood sugar regulation and bone health. Cutting out high-protein dairy products could make it harder to hit your daily protein goals. 


Source link

Leave a Reply

Subscribe to Our Newsletter

Get our latest articles delivered straight to your inbox. No spam, we promise.

Recent Reviews


What is KPI

KPI is nothing but a measurable value, which shows the best ways for organizations to achieve their essential goals of the business with efficiency. Companies take the help of KPIs at various levels for their successful evolution to reach targets. The concentration of high-level KPIs is on the entire business performance, and the focus of low-level KPIs is on departments processes like HR, marketing, sales, support, etc. we can say it simply as a set of value measures, which is used by organizations to evaluate its entire performance.

 Become a Power BI Certified professional by learning this HKR Power BI Training !

When to use a KPI

It is the best choice when we decide to use KPI. We can use KPIs in the given situations.

  • We can use KPI for progress measurement and to answer the questions like “where am I in front or behind”.
  • We can also use KPIs for distance measuring for companies’ business objectives, and we can answer the questions like “how much distance is there behind or ahead.

Power BI Training

  • Master Your Craft
  • Lifetime LMS & Faculty Access
  • 24/7 online expert support
  • Real-world & Project Based Learning

KPI requirements

The visuals of KPIs are based on particular measures, the main intention of these KPIs is to help us in present value evaluation and the defined target metrics. Base measures are essential for the visuals of KPIs, which helps in value evaluation, target measurement, and target measurement. Its dataset requires maintaining the goal values for KPI, in the case when there are no goal values with our database, then we may design them by combining an excel sheet with our model of data goals and the file of PBIX. 

Prerequisites to use KPI in Power BI

There are two main prerequisites to use KPIs in power bi, the given below are those prerequisites.

  • To use KPIs in power bi we need to install a power bi desktop in our system.
  • We have to maintain the data source and the relevant existing report for KPI which we designed.

Requirements for creating KPI in Power BI

To build KPI in power bi there are some essential requirements, they are like threshold value, trend, target value, measure value, etc. for value evaluation we must require the base measure. For our power bi report generation, we need to choose the goal and base value from the database, which you are working on currently. With the help of these values added to our database, in later sections we are permitted to create a KPI. 

 Top 50 frequently asked Power BI Interview Questions !

How to create KPI

Let us see the process of KPI creation in the Power BI desktop with simple steps.

  • First, we need to open the report editor then choose the required report. On the right side there is a visualization pane, click on the KPI visual.
  • After the KPI visual selection three blank spaces appear on the field section, they are target measure, trend axis, and indicator.
  • The field panel contains all the fields of imported tables, we take the values from them to put in the indicator column.
  • In the next step, we fill the columns of the trend axis with the fiscal month and the target measure column with the goals field.
  • As shown in the given diagram, KPI is ready with our selected values. Now we need to format this KPI by choosing the paint roller icon in the format section. Then we are allowed to fix the properties for title background, title, color coding, trend axis, etc.
  • Finally after the completion of the KPI formatting process according to our preferences, the output came as shown below.
Business Intelligence & Analytics, power-bi-kpi-description-0, Business Intelligence & Analytics, power-bi-kpi-description-1

Subscribe to our YouTube channel to get new updates..!

KPI elements in Power BI

We can classify KPI in Power BI into three elements They are thresholds status, target value, and base value.

  • Base value: It is a measured value, that is an average of sales and gross profit.
  • Target value: It is also the absolute measure value, it is a bunch of goals the evaluated target value. We can fix the target up to 200 units per month for a while, then our base value will be recorded for the month. Either it may be less than 200, 200 or more than 200.
  • Thresholds status: Thresholds status offers a range for base and target values evaluation, the visual also provides low and high end of the range between the values fall of base and target.

Advantages of KPI in Power BI

KPI is simple to use, we may utilize them to expose the complex information equally. The given below are the two main advantages of KPIs in Power BI.

  • We can utilize KPIs for progress measures, they are like negative and positive changes. We can know if we are gaining proper results or not, about meeting targets, and lagging.
  • KPIs are also used for distance measures for the target, we can analyze the distance like how far we have with the achievement of our target.

Want to know more about Power BI,visit here Power BI Tutorial !

KPI custom visualizations

Along with built-in KPIs, which we created there are various visualizations. Those visualizations are related to KPI, which we can install from the marketplace of Power BI. We can add them by clicking on the icon from the marketplace, the given below are various visualizations.

  • Bullet charts: It works as a representative for measure value and target value evolution, it also offers the evaluation of context performance through marketers’ performance.
  • Dual KPI: Two visuals of KPI are exposed by a dual KPI that are next to each other, those visuals are dynamic and they can change the information in KPI. They are informative but there is no need for huge space for Dual KPI. 
  • KPI indicator: The visuals of the KPI indicator display the status with a cloured background. It displays the base value and the percentage is used to indicate the variations between the values of base and target.
  • Power KPI: It is a kind of multi-lined chart, which displays the base value in lines format with various colors. 

Power BI Training

Weekday / Weekend Batches

Conclusion:

KPIs are simple in looks, but at the same time they are complex and while creating we may face problems. We require our KPI to be up to mark when we are new to using KPIs. As this is complex we must be careful and get a complete idea of these KPIs, then only we utilize it properly in power bi. We thought this blog may help you as much as you require. If you had any queries or questions that need to be answered please do comments below, to get your question answered quickly by our HKR expert trainers.

Related Article:

Power BI Resume

Power BI Matrix


Source link