Aeroplan increasing many partner redemption rates from June 1


Air Canada’s Aeroplan loyalty program will increase the cost of many partner redemption rates for bookings made from June 1.

While devaluations are an unwelcome and unfortunate reality of earning points and miles, this price increase is relatively mild compared with recent ones announced by other programs. Aeroplan partner redemptions will remain a great deal, and the program has at least given more than one month’s notice of the changes.

Here’s what’s changing and what you should do now.

Related: Why Air Canada Aeroplan has become my favorite Star Alliance loyalty program

Aeroplan will increase many partner award rates

Aeroplan will retain a fixed award chart for most partner-operated flights. For flights operated by Air Canada and select partner airlines like Emirates, Etihad Airways and United Airlines, Aeroplan will continue to price these dynamically, which often doesn’t offer great value.

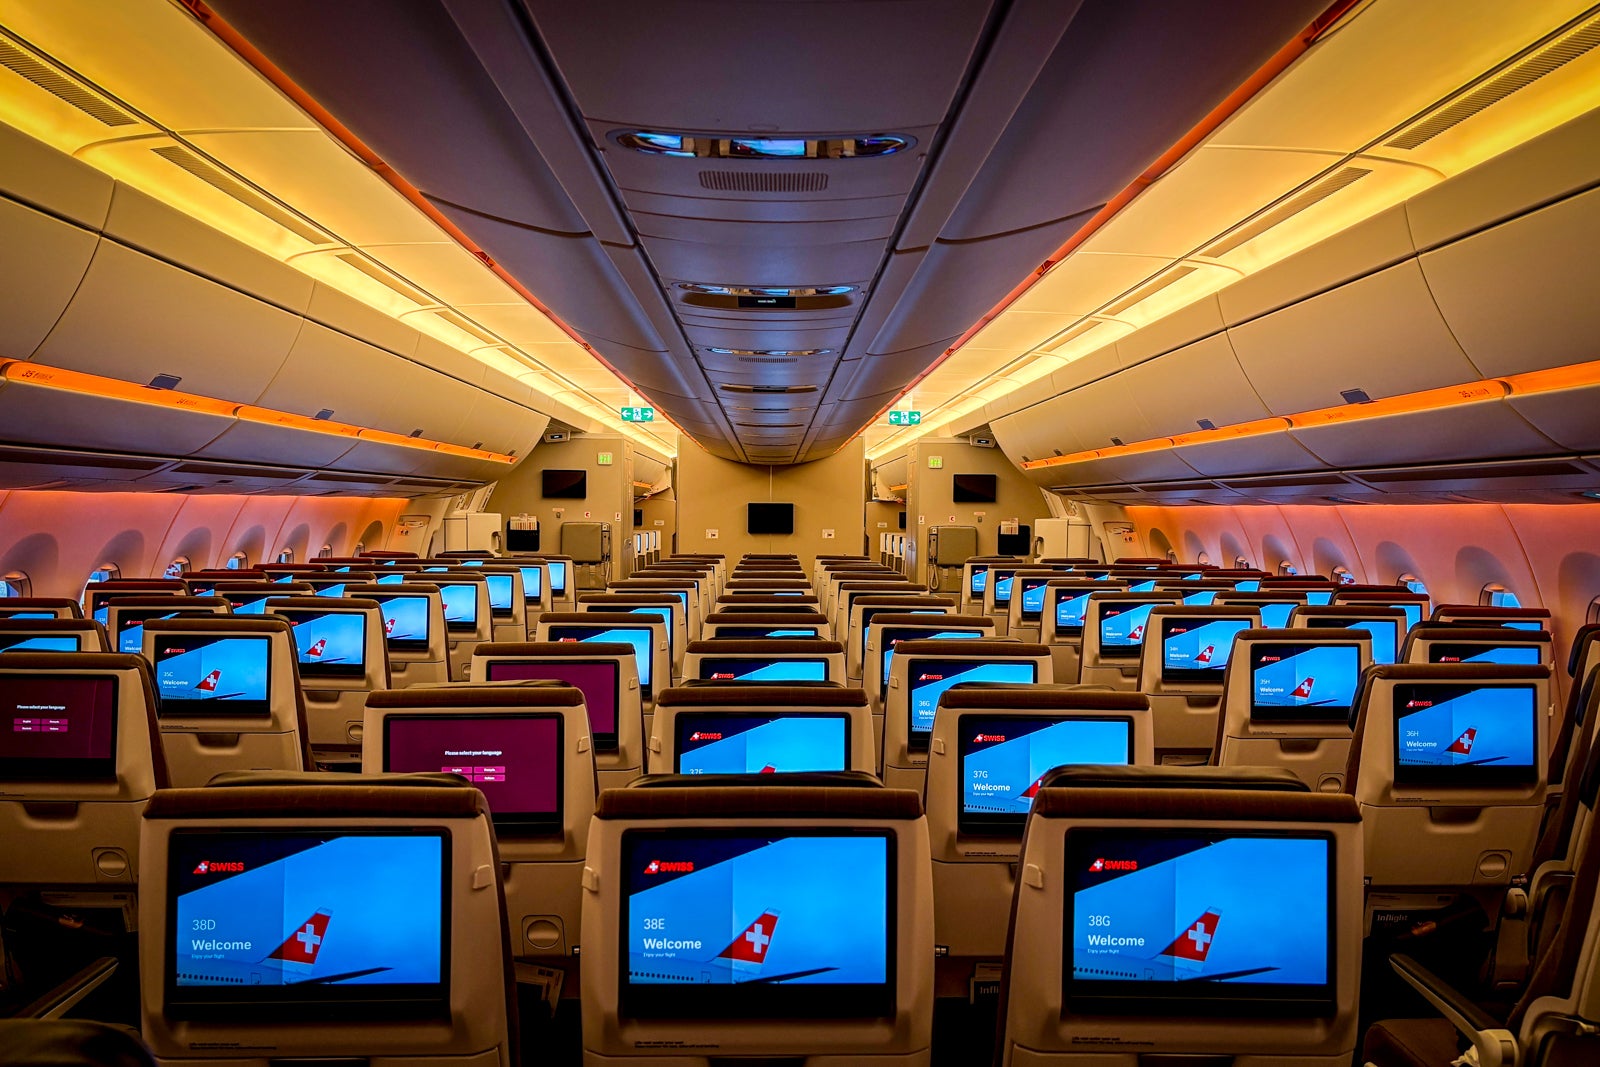
Aeroplan uses a unique hybrid award chart system that combines region-based and distance-based pricing. Regions are generously defined and have been a great way to book flights on partner-operated airlines like Lufthansa, EVA Air and TAP Air Portugal at great rates, especially in premium cabins.

Redemptions from North America to Europe will see many changes, according to newly published award charts, with prices for bookings made from June 1 on (regardless of travel date) changing to:

Distance Class of service Current price (one-way, per person) New price from June 1
0 to 4,000 miles (for example, nonstop from Newark Liberty International Airport (EWR) to London’s Heathrow Airport (LHR))

Economy

35,000 points

32,500 points (down 7%)

0 to 4,000 miles (for example, EWR to LHR)

Business

60,000 points

No change

0 to 4,000 miles (for example, EWR to LHR)

First

90,000 points

No change

4,001 to 6,000 miles (for example, nonstop from Los Angeles International Airport (LAX) to Munich Airport (MUC))

Economy

40,000 points

42,500 points (up 6%)

4,001 to 6,000 miles (for example, LAX to MUC)

Business

70,000 points

75,000 points (up 7%)

4,001 to 6,000 miles (for example, LAX to MUC)

First

100,000 points

120,000 points (up 20%)

6,001 to 8,000 miles (for example, from San Francisco International Airport (SFO) to Athens International Airport (ATH) in Greece via Lisbon Airport (LIS) in Portugal)

Economy

55,000 points

60,000 points (up 9%)

6,001 to 8,000 miles (for example, SFO to ATH via LIS)

Business

85,000 points

90,000 points (up 6%)

6,001 to 8,000 miles (for example, SFO to ATH via LIS)

First

130,000 points

150,000 points (up 15%)

The longtime sweet spot of flying from the Northeast to Western Europe in business class on flights of under 4,000 miles remains unchanged, which is great news for travelers.

EDWARD RUSSELL FOR THE POINTS GUY

Redemptions to the “Pacific” region, which generously covers Asia, Australia, New Zealand and the Pacific islands, will also see the following changes:

Reward your inbox with the TPG Daily newsletter

Join over 700,000 readers for breaking news, in-depth guides and exclusive deals from TPG’s experts

Distance Class of service Current price (one-way, per person) New price from June 1
0 to 5,000 miles (for example, nonstop from Seattle-Tacoma International Airport (SEA) to Tokyo’s Haneda Airport (HND))

Economy

35,000 points

32,500 points (down 7%)

0 to 5,000 miles (for example, SEA to HND)

Business

55,000 points

No change

0 to 5,000 miles (for example, SEA to HND)

First

90,000 points

No change

5,001 to 7,500 miles (for example, nonstop from Chicago’s O’Hare International Airport (ORD) to Tokyo’s Narita International Airport (NRT))

Economy

50,000 points

No change

5,001 to 7,500 miles (for example, ORD to NRT)

Business

75,000 points

No change

5,001 to 7,500 miles (for example, ORD to NRT)

First

110,000 points

120,000 points (up 9%)

7,501 to 11,000 miles (for example, nonstop from Houston’s George Bush Intercontinental Airport (IAH) to Sydney Airport (SYD))

Economy

60,000 points

65,000 points (up 8%)

7,501 to 11,000 miles (for example, IAH to SYD)

Business

87,500 points

102,500 points (up 17%)

7,501 to 11,000 miles (for example, IAH to SYD)

First

130,000 points

140,000 points (up 8%)

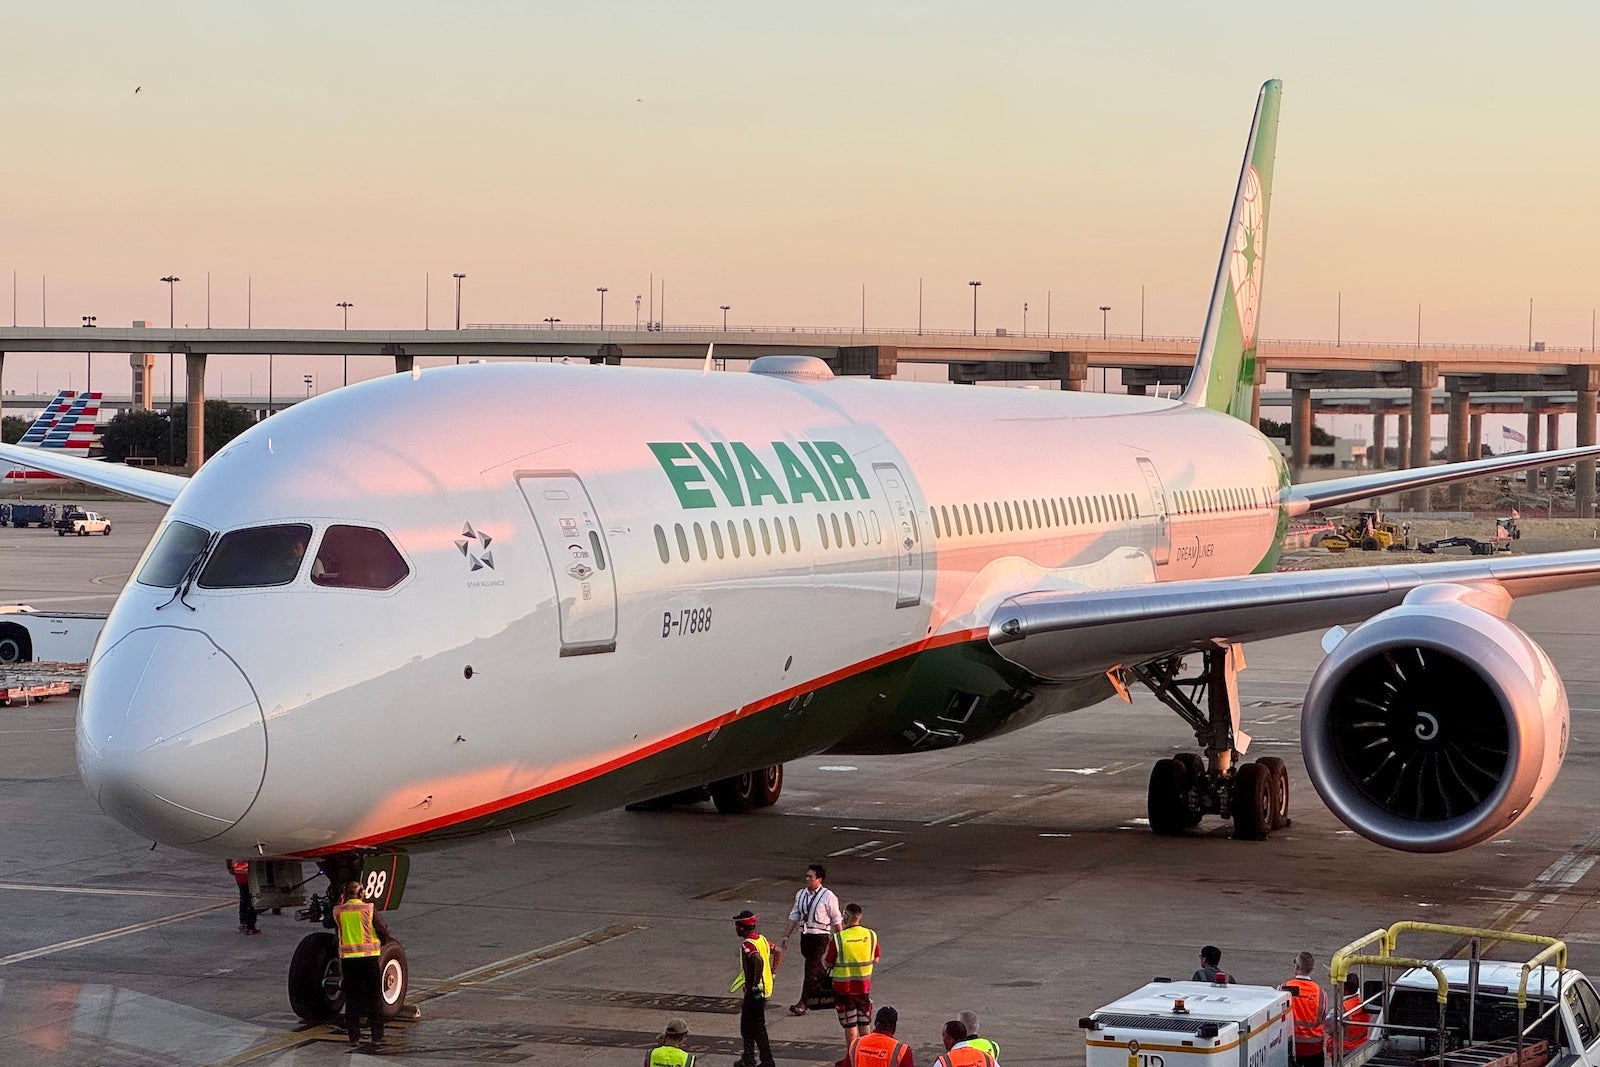
With few airlines offering first-class partner award seats to this region in 2026, it’s great to see most business-class rates, like EVA Air’s impressive product to Taiwan, remain unchanged.

Eva Air 787
SEAN CUDAHY/THE POINTS GUY

There are also several changes to redemptions made from the Atlantic to the Pacific regions, as follows:

Distance Class of service Current price (one way, per person) New price from June 1
0 to 2,500 miles (for example, nonstop from Chhatrapati Shivaji Maharaj International Airport (BOM) in Mumbai to Suvarnabhumi Airport (BKK) in Bangkok)

Economy

25,000 points

No change

0 to 2,500 miles (for example, BOM to BKK)

Business

40,000 points

47,500 points (up 19%)

0 to 2,500 miles (for example, BOM to BKK)

First

50,000 points

55,000 points (up 10%)

2,501 to 5,000 miles (for example, nonstop from Dubai International Airport (DXB) to Singapore Changi Airport (SIN))

Economy

30,000 points

40,000 points (up 33%)

2,501 to 5,000 miles (for example, DXB to SIN)

Business

60,000 points

75,000 points (up 25%)

2,501 to 5,000 miles (for example, DXB to SIN)

First

80,000 points

95,000 points (up 19%)

5,001 to 7,000 miles (for example, from Paris-Charles de Gaulle Airport (CDG) to BKK)

Economy

50,000 points

60,000 points (up 20%)

5,001 to 7,000 miles (for example, CDG to BKK)

Business

80,000 points

92,500 points (up 16%)

5,001 to 7,000 miles (for example, CDG to BKK)

First

100,000 points

120,000 points (up 20%)

Related: United adds 3 new Asia-Pacific destinations with a unique twist

What’s not changing

The following award charts will not change in price in June:

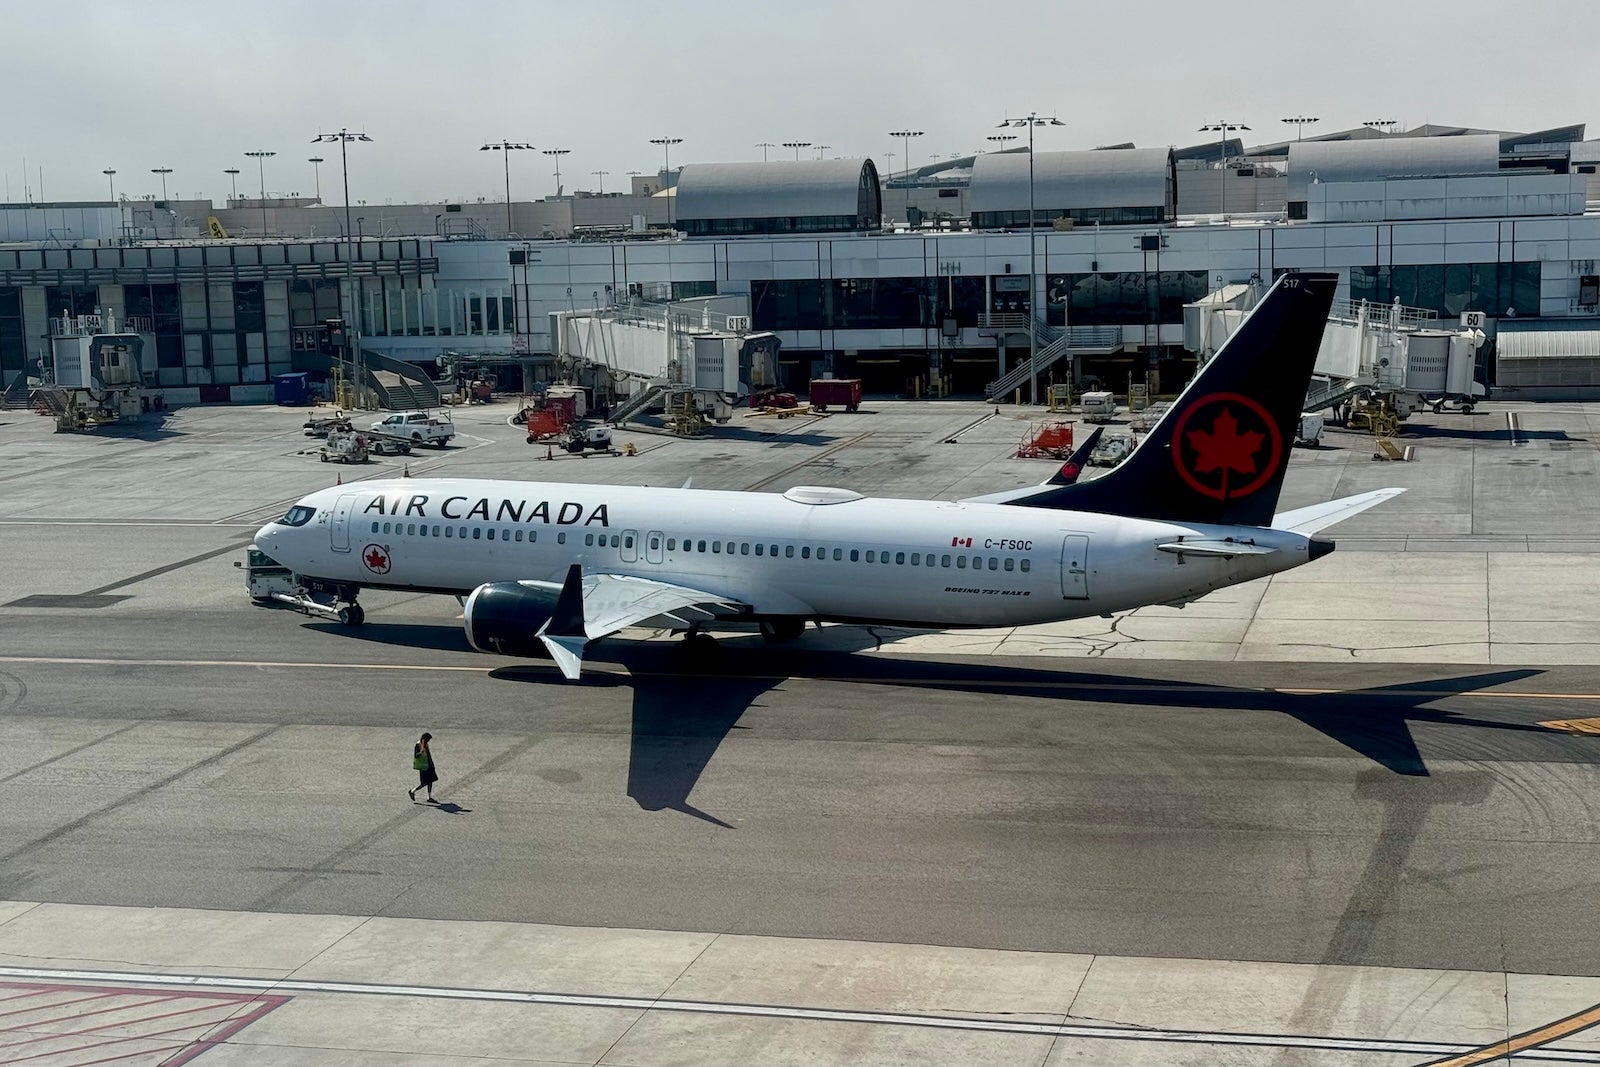
  • Within North America (such as domestic United-operated flights and short-haul flights to Canada)
  • Between North America and South America and within South America (such as flights operated by Copa Airlines)
  • Between South America and the Atlantic and between South America and the Asia-Pacific region

How to earn Aeroplan points

You can transfer the following credit card rewards to Aeroplan at a 1:1 transfer ratio:

Related: Why transferable points and miles are worth more than other rewards

air canada plane
SEAN CUDAHY/THE POINTS GUY

Bottom line

Devaluations are never good news, and this announcement from Air Canada’s Aeroplan program is no different. Luckily, the rate increases are relatively mild, and you have more than a month to lock in redemptions at existing rates. The latter is particularly welcome, as many devaluations are made without notice.

Aeroplan is and will continue to be a great Star Alliance redemption option. It also has a number of nonalliance partners to earn and redeem points with. Not to mention, as a transfer partner of so many major transferable currencies, Aeroplan points are easy to earn.

Just remember to make your bookings prior to June 1 if you wish to book at current rates.

Related reading:


Source link

Leave a Reply

Subscribe to Our Newsletter

Get our latest articles delivered straight to your inbox. No spam, we promise.

Recent Reviews


What is Power BI?

Power BI is one of the popular business intelligence tools developed by Microsoft Corporation to offer various data modeling capabilities like data preparations, data visualizations, data discovery, and generating interactive data analytic dashboards. With the help of Power BI users can make powerful business-related decisions. This Power BI tool helps users to pull the data using various formats such as images, excel sheets, spreadsheets, and videos. The Power BI tool also helps to centralize the database management system, and you can also visualize the data model on it.

Become a Power BI Certified professional by learning this HKR Power BI Training !

What is Google data studio?

Google data studio is an easy-to-use tool that is used to create a beautiful data visualization within a minute. This is a cloud-based application that can be run on the various top web browsers like chrome, safari, and firefox. This type of tool is able to deliver stunning, and insightful reports without much action from the user. Google data studio also comes up with a free-to-use license for personal or commercial use. With the help of Google data studio dashboard, you can access various types of charts such as charts, bars, pie, lines, Areas, scatter, etc, and this also adds up value to the data reports.

Comparison of Power BI and Google data studio:

Here we are going to explain the major comparison between power BI and Google data studio based on a few functionalities. Let’s start it;

Installation:

Power BI tool has a number of ways to install or configure it, and it all depends on the license. The basic, and very best way to install Power BI as a desktop application on your desktop. Power BI application is quick and straightforward so all you need is just a modern PC with 4GB of RAM (ideally 8GB of RAM) and running windows 8 operating system version or later. Power BI is a Microsoft product, and it is not available for MAC operating systems. 

Google data studio is completely web-based, so you do not need to install it on your computer/pc. Directly you can access them by logging into the Google page like other Google products. 

Data source:

Power BI consists of various pre-built connectors, and they enable you to connect to a wide variety and ever-expanding data sources. PowerBI’s web connectors help you to import data from almost any data source that includes Amazon, Google, and other Microsoft competitors.

Whereas Google data Studio data connectors are much smaller and offer only 18 connectors that are built by Google. inc itself. There are also 400+ connectors built by Data studio partners. These types of connectors you get to see only for advertising, media, and content-related websites.

Data transformation:

Power BI offers a full range of data transformations by using a power Query engine. Power Query lets you perform ETL (Extract, transfer, and loading) operations on the data which you have and prepare it for visualization. Users can also make use of data analysis expression (DAX) to build formulas and expressions. Power BI has a lot of capabilities to perform data transmission operations. 

Whereas Google data studio lags behind this feature. In Google data studio, the only way to perform data transformation is by using JOIN keys. So by default google assumes that you already have clean data for the visualization.

Ease of use:

If you are familiar with MS Excel, then Power BI would be a great choice.  But to access power BI, some sort of struggle is required to connect and integrate with different data sources. Power BI has also offered better functionalities than the Google data studio and also helps you with a drag-and-drop feature. 

Whereas Google data studio is very easy to navigate and the learning curve is minimal. The user interface of this platform is extremely intuitive as long as you have clean datasets. Only one thing you need to concentrate on is a drag-and-drop feature that helps you to create quick reports.

Sharing:

In Power BI report sharing is a complex task that is compared to the Google data studio. The biggest concern is that it is impossible to share a report directly from the desktop applications. Every time you need to publish the reports in the Power BI services. However mobile applications let you share a dashboard or report directly from the application.

In power BI you can share your reports and dashboards with internal and external collaborators. 

On the other hand, sharing data with google data studio is an easier task. With the help of email or links, you can share the reports in the Google data studio. In google, the recipients dont need to pay any subscription fees because Google offers a free google data studio tool.

Mobile compatibility:

Power BI consists of the native applications for Android, Windows, and IOS smartphones. In Power BI smart mobile application, you can perform the below vital tasks:

  • Visualizing data reports
  • Filtering of the data from a report.
  • Adding notes to the reports.
  • Getting a notification and setting alerts.
  • Exploring on-premise data reports.

Whereas Google data studio does not have a mobile application version so that users can visualize the data reports using the mobile browser, editing the report could be a challenging task. 

Community and online resources:

We already know that Microsoft Power BI has a huge knowledge base community to learn and resolve the issues about the platform usage. When you login into the communities, you will get to see a lot of content which are related to the platform guide. For example, themes gallery, custom visual studios, data stories gallery, developer, etc.

Similarly, Google data studio also has robust communities. Here the community gallery section of this tool gives you access to various third-party visualization widgets. 

Cost:

Power BI desktop is free but can be accessed only by beginners who want to know the basic things about the tool. For the business purpose, you need to share a desktop, and the cost it will going to charge is $9.99 per user/per month (premium subscription). Power BI Pro is a cloud-based application that can be used for collaboration, sharing, publishing, etc. If you are an expert, and you want power BI for both the on-premise and cloud-based reporting, support for big data and analytics, dedicated cloud computes, and storage resources you can opt for Power BI premium at $4995/year. 

Whereas the Google data studio is free to use application. And all you need is just a Google account.

Functionalities:

Power BI tool is available for both beginners and advanced level experts due to its tons of data manipulation features. It also helps you to access data through the data visualization elements like charts, bars, tables, graphs, etc. one more functionality of the Power BI is, the tool gets refreshed itself  8 times a day.

Whereas Google data studio comes up with fewer features when compared to the Google data studio as it is only a data visualization application. However, its in-memory BI engine is a powerful feature that helps users to eliminate the data visualization lags, especially used for the larger number of data sets. The Google data studio application gets refreshed itself every 12 hours.

Want to know more about Power BI,visit here Power BI Tutorial !

Power BI Training

  • Master Your Craft
  • Lifetime LMS & Faculty Access
  • 24/7 online expert support
  • Real-world & Project Based Learning

Pros and Cons of the Power BI:

First, let’s start with the Power BI:

Advantages of the Power BI:

Below are the primary advantages of the Power BI:

Offers easy data exploration and data visualization:
This is the world of data exploding, this tool offers the ability to explore valuable data and also perform data visualization tasks to get greater results. When compared with other business intelligence tools, I think this is an awesome tool in the data visualization process.

Acts as a managed self-service Business intelligence tool:
This Microsoft business intelligence tool provides an effective self-service business intelligence tool. The MSBI also acts as a Microsoft Excel that is used by everyone in their day-to-day activities to produce and report the data analytics.

This tool makes use of Native MS excel features:
The MSBI tool makes use of Microsoft Excel features to the core in order to produce effective data analysis. By using excel Microsoft excel features it’s very easy to collect data from multiple data sources.

MSBI tool supports Web service applications:
MSBI tool works well with programming languages like .NET and SQL database servers to build an effective web service application and also offers abundant benefits to the clients.

End-to-end Business solutions:
MSBI provides you with a great business solution for your organization and enables users to make effective business decisions. This tool offers entire top-to-bottom business solutions.

Data warehouse applications:
Business intelligence tools offer greater data analytical solutions. You can collect the data warehouse from various sources. This type of warehousing is more suitable to extract the information to carry out the data analytical task effectively.

Limitations of the Microsoft Power BI:

Below are the few drawbacks of the Microsoft Power BI:

  • This tool is very difficult to implement. You need to loop them in the development team, the IT team to get it executed.
  • To implement row-level security in Power BI and tie your web application users with Power BI users.
  • With users coming and leaving an organization, it becomes a nightmare to manage.
  • Requires considerable investment.
  • You need to buy a premium capacity.
  • Not feasible for pro users.
  • Still users need to visit your web page and the information is not delivered to them.

Top 50 frequently asked Power BI Interview Questions !

HKR Trainings Logo

Subscribe to our YouTube channel to get new updates..!

Advantages of the Google data studio:

Below are the few benefits of the Google data studio;

It’s a free tool to use:
If you have a Google account, then it’s free to access the tool.

Offers customized report dashboard:
 Google data studio tool allows users to customize the report dashboards with a wide range of text formatting options available such as designs, Styles, graphs, and text headers. If you have new raw data, that will be customized on the dashboard based on your requirement with the help of this pre-built text formatting feature.

Here are some of the things you can format the data:

  • Page layout
  • Text formats 
  • Graphs 
  • Metrics
  • Style element

Offers modern and interactive data visualization:

In Google data studio with the help of a few clicks, you can easily create an engaging and visually appealing dashboard that will attract your audience for sure.

Automated report sharing dashboards:
Google data studio allows you to build an automated report sharing dashboard with the help of real-time data, this process saves your time while reporting.

Offers shareable dashboards:
Google data studio offers a sharing dashboard with the users for multiple tasks. This feature also helps you to communicate among peers and business partners.

You can share the report with the help of these things:

  • Link sharing 
  • Email permissions.
  • Schedules email deliveries.

Limitations of the Google data studio:

Here are the few drawbacks of the Google data studio:

  • Lack of real-time updates with respect to the dashboard.
  • Slow speed in case of live connections.
  • There is no on-premise deployment option available.
  • Lack of native data connectors availability.
  • A limited number of charts per dashboard report
  • Limited interaction with the elements.

Which is the best tool between Power BI and Google data studio?

Here we come to the conclusion part of the article, you can make use of Google data studio sources such as Google data analytics with the data that is readily usable, no need for sharing any complex information. Google data studio tool is a good fit for quick reporting. Most importantly it is a free tool to use unless you need some data connectors.

On the other hand, we have Power BI, this tool is used if you have a wide variety of data transformation options, all you need is a BI tool that has advanced features like greater data transformation capabilities, customization options, and if you don’t mind in paying. Power BI is a powerful robust data visualization and analytical tool, it requires some sort of excel knowledge to perform Power BI dashboards.

You can choose the tool as per your requirements, and data connectivity sources.

Power BI Training

Weekday / Weekend Batches

Final thought:

We tried to clear all our audiences’ doubts regarding choosing the best tool between Google data studio and power BI. Both the tools are scalable and robust to use and configure. In this Power BI VS google data studio post, we have mentioned major differences based on the different categories, pros, and cons of the tools.

Related Articles:


Source link