BMW’s X5 Finally Goes Electric With An Impressive 435 Miles Of Range


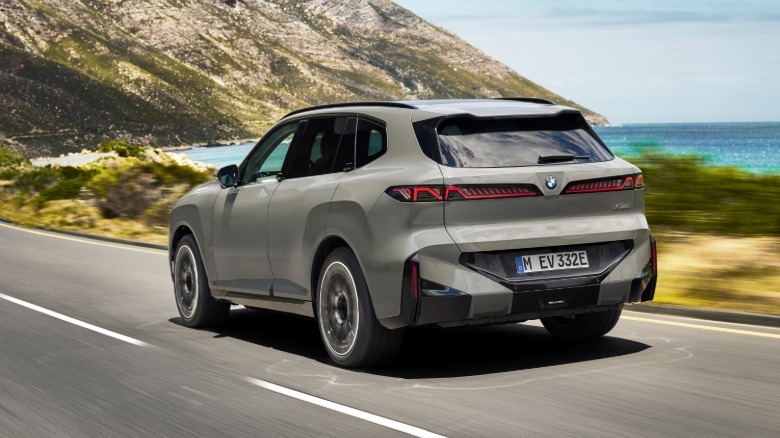
BMW has unveiled its new X5 lineup, and for the first time, there’s a fully electric version among the many powertrain options. The iX5 60 xDrive EV offers impressive range and power, along with an all-new design that features wild new “X” shaped headlights. 

In the past, BMW has used separate platforms for its EV and ICE vehicles, with X3 and iX3 series being a good example of that. However, the X5 will offer a common platform and BMW’s “Neue Klasse” styling for its numerous power options. Along with the EV, those include gasoline, diesel, plug-in hybrid and even hydrogen. BMW says that the larger X5 platform will work with all of those powertrains without compromises. 

The iX5 60 xDrive comes with BMW’s sixth-generation eDrive technology. With a massive 140kWh battery (smaller options will be available later) and 800 volt architecture, it offers up to 435 miles of EPA range. That would make it one of the longest-range vehicles available for sale in North America, with only pickups like the Chevrolet Silverado EV 8WT offering larger batteries. It will charge quickly, as well, thanks to the 450kW bi-directional charging capability. BMW has yet to provide exact charging times, but some napkin math suggests it could charge to 80 percent in about 20 minutes at the maximum 450kW.

With dual 325 horsepower and 245 horsepower rear and front motors, the iX5 60 xDrive puts 570 total horsepower to the ground. That will allow it to accelerate from 0 to 62 MPH in just 4.7 seconds, not bad for a 6,371 pound vehicle. By the way, that 3.18 ton weight makes it BMW’s heaviest regular production vehicle and a true pedestrian hazard. To make such a big vehicle drive decently, BMW equipped the iX5 with a full air suspension, and you can get it with optional active anti-roll bars and four-wheel steering. 

The new X headlights are a fun way to complement the X5 branding, despite the resemblance to Elon Musk’s X logo (and a slightly morbid connotation). You’ll also notice a lack of door handles, with those having been replaced by button-operated “winglet” handles to make the iX5 more streamlined. Doors can be opened and closed using either the key fob or BMW’s app. Two other BMW signature X5 and electric design features have also been banished: the split folding tailgate and and iDrive knob. 

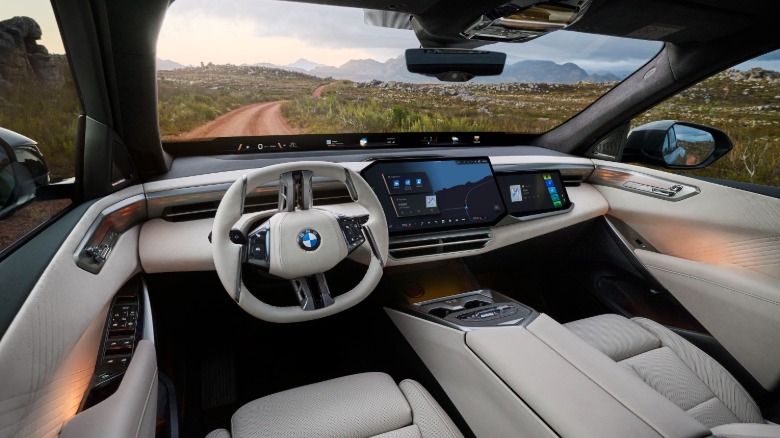
Styling otherwise isn’t too controversial, with a more squarish body, several new creases and fenders that flare a bit more than before. You also see the vertically aligned kidney “Iconic Glow” front-end found on other Neue Klasse vehicles. Inside, much has changed as well. The iX5 has a massive new 17.9-inch center touchscreen, along with an optional 14.6-inch passenger display. It’s also equipped with BMW’s new vertical spoke steering wheel. 

The sound system is impressive, with a standard 280-watt 12-speaker system or optional Bowers & Wilkins Dolby Atmos system pumping out up to 775 watts. The Panoramic iDrive assisted driving and infotainment systems are powered by BMW’s Operating System X software (based on Android Open-Source Project). It offers an “extensive app, video and gaming portfolio,” BMW explains, or you can use your smartphone as a mobile hotspot. Drivers will also have the option of using Apple CarPlay and Android Auto as standard, fortunately

The fully-electric iX5 60 eDrive will start at $79,800 (destination charges excluded) and should be on dealer lots by the end of 2026. BMW is also offering the X5 50e plug-in hybrid at $77,500, and the standard ICE X5 40 will start at $69,800. Those prices seem… reasonable? considering BMW’s luxury branding and an average US car price around $50,000.  


Source link

Leave a Reply

Subscribe to Our Newsletter

Get our latest articles delivered straight to your inbox. No spam, we promise.

Recent Reviews


What is KPI

KPI is nothing but a measurable value, which shows the best ways for organizations to achieve their essential goals of the business with efficiency. Companies take the help of KPIs at various levels for their successful evolution to reach targets. The concentration of high-level KPIs is on the entire business performance, and the focus of low-level KPIs is on departments processes like HR, marketing, sales, support, etc. we can say it simply as a set of value measures, which is used by organizations to evaluate its entire performance.

 Become a Power BI Certified professional by learning this HKR Power BI Training !

When to use a KPI

It is the best choice when we decide to use KPI. We can use KPIs in the given situations.

  • We can use KPI for progress measurement and to answer the questions like “where am I in front or behind”.
  • We can also use KPIs for distance measuring for companies’ business objectives, and we can answer the questions like “how much distance is there behind or ahead.

Power BI Training

  • Master Your Craft
  • Lifetime LMS & Faculty Access
  • 24/7 online expert support
  • Real-world & Project Based Learning

KPI requirements

The visuals of KPIs are based on particular measures, the main intention of these KPIs is to help us in present value evaluation and the defined target metrics. Base measures are essential for the visuals of KPIs, which helps in value evaluation, target measurement, and target measurement. Its dataset requires maintaining the goal values for KPI, in the case when there are no goal values with our database, then we may design them by combining an excel sheet with our model of data goals and the file of PBIX. 

Prerequisites to use KPI in Power BI

There are two main prerequisites to use KPIs in power bi, the given below are those prerequisites.

  • To use KPIs in power bi we need to install a power bi desktop in our system.
  • We have to maintain the data source and the relevant existing report for KPI which we designed.

Requirements for creating KPI in Power BI

To build KPI in power bi there are some essential requirements, they are like threshold value, trend, target value, measure value, etc. for value evaluation we must require the base measure. For our power bi report generation, we need to choose the goal and base value from the database, which you are working on currently. With the help of these values added to our database, in later sections we are permitted to create a KPI. 

 Top 50 frequently asked Power BI Interview Questions !

How to create KPI

Let us see the process of KPI creation in the Power BI desktop with simple steps.

  • First, we need to open the report editor then choose the required report. On the right side there is a visualization pane, click on the KPI visual.
  • After the KPI visual selection three blank spaces appear on the field section, they are target measure, trend axis, and indicator.
  • The field panel contains all the fields of imported tables, we take the values from them to put in the indicator column.
  • In the next step, we fill the columns of the trend axis with the fiscal month and the target measure column with the goals field.
  • As shown in the given diagram, KPI is ready with our selected values. Now we need to format this KPI by choosing the paint roller icon in the format section. Then we are allowed to fix the properties for title background, title, color coding, trend axis, etc.
  • Finally after the completion of the KPI formatting process according to our preferences, the output came as shown below.
Business Intelligence & Analytics, power-bi-kpi-description-0, Business Intelligence & Analytics, power-bi-kpi-description-1

Subscribe to our YouTube channel to get new updates..!

KPI elements in Power BI

We can classify KPI in Power BI into three elements They are thresholds status, target value, and base value.

  • Base value: It is a measured value, that is an average of sales and gross profit.
  • Target value: It is also the absolute measure value, it is a bunch of goals the evaluated target value. We can fix the target up to 200 units per month for a while, then our base value will be recorded for the month. Either it may be less than 200, 200 or more than 200.
  • Thresholds status: Thresholds status offers a range for base and target values evaluation, the visual also provides low and high end of the range between the values fall of base and target.

Advantages of KPI in Power BI

KPI is simple to use, we may utilize them to expose the complex information equally. The given below are the two main advantages of KPIs in Power BI.

  • We can utilize KPIs for progress measures, they are like negative and positive changes. We can know if we are gaining proper results or not, about meeting targets, and lagging.
  • KPIs are also used for distance measures for the target, we can analyze the distance like how far we have with the achievement of our target.

Want to know more about Power BI,visit here Power BI Tutorial !

KPI custom visualizations

Along with built-in KPIs, which we created there are various visualizations. Those visualizations are related to KPI, which we can install from the marketplace of Power BI. We can add them by clicking on the icon from the marketplace, the given below are various visualizations.

  • Bullet charts: It works as a representative for measure value and target value evolution, it also offers the evaluation of context performance through marketers’ performance.
  • Dual KPI: Two visuals of KPI are exposed by a dual KPI that are next to each other, those visuals are dynamic and they can change the information in KPI. They are informative but there is no need for huge space for Dual KPI. 
  • KPI indicator: The visuals of the KPI indicator display the status with a cloured background. It displays the base value and the percentage is used to indicate the variations between the values of base and target.
  • Power KPI: It is a kind of multi-lined chart, which displays the base value in lines format with various colors. 

Power BI Training

Weekday / Weekend Batches

Conclusion:

KPIs are simple in looks, but at the same time they are complex and while creating we may face problems. We require our KPI to be up to mark when we are new to using KPIs. As this is complex we must be careful and get a complete idea of these KPIs, then only we utilize it properly in power bi. We thought this blog may help you as much as you require. If you had any queries or questions that need to be answered please do comments below, to get your question answered quickly by our HKR expert trainers.

Related Article:

Power BI Resume

Power BI Matrix


Source link