Companies that will use your points and miles to book your travel


One of the most common questions we get in emails from TPG readers is, “Can you help me book using my miles?”

Unfortunately, the answer is no because we just don’t have the resources to actually book trips for readers. (It’s a lot of work!)

Instead, we usually refer people to companies that can better help them. Here’s a quick guide to the companies and teams that TPG has used or recommended over the years.

Cranky Concierge

Cranky Concierge landing page.
Cranky Concierge landing page. CRANKY CONCIERGE

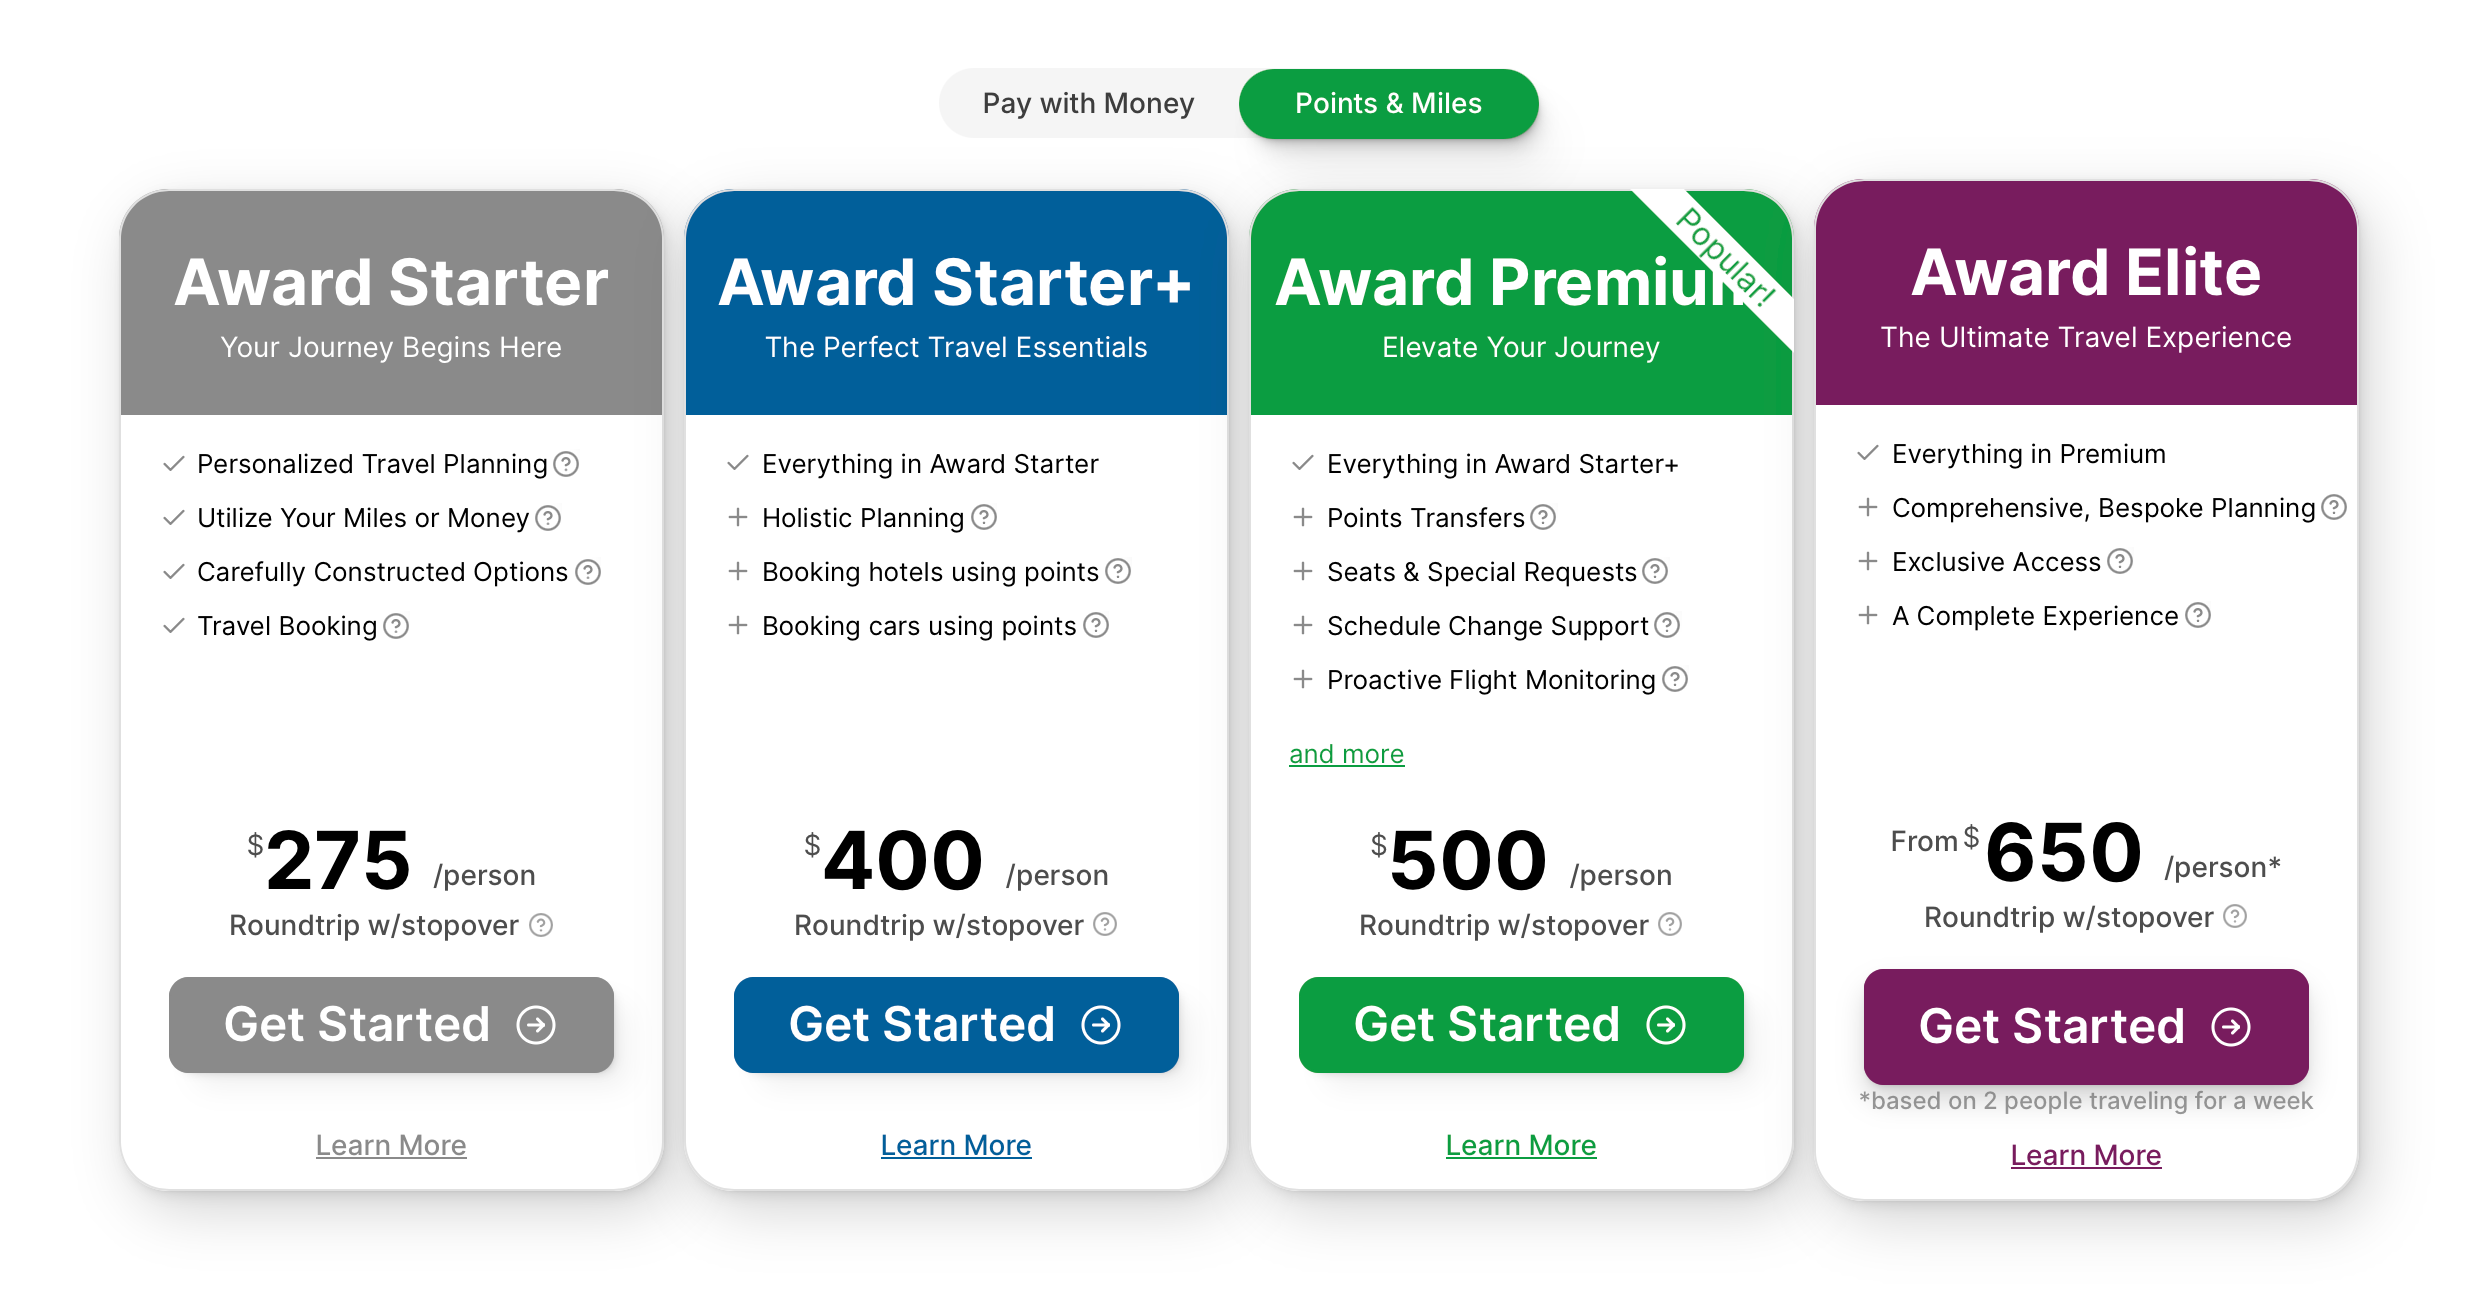
Cranky Concierge is one of our favorite travel-planning services. The service, created by Brett Snyder, initially focused on using points and miles to book dream trips but has since expanded into an all-encompassing travel agency.

TPG has used Cranky Concierge many times over the years to help with some special employee trips, such as a hotel stay at Six Senses Shaharut back in 2022. The company was instrumental in securing the IHG One Rewards points required for the stay, even after the hotel told us the booking didn’t qualify.

A hotel pool surrounded by desert with mountains in the distance
The Six Senses Shaharut in Israel. CLINT HENDERSON/THE POINTS GUY

The team is also great at finding elusive award inventory for business-class seats. As you can see, it costs $275 for Cranky Concierge to book you a round-trip flight using miles (or a combination of miles and cash). If you are looking to only pay cash for the trip, the fee is slightly lower, starting at $95.

Cranky Concierge pricing. C
Cranky Concierge pricing. CRANKY CONCIERGE

Former TPG staffer Benét Wilson is a huge fan. “I have used Cranky Concierge regularly. I’m going to DPS [Bali’s I Gusti Ngurah Rai International Airport] on April 16,” she said. “I had booked Emirates out of IAD [Dulles International Airport], but my flight was changed. Plus, with all the unrest in the Middle East, my concierge was proactive in looking at other options. This company is worth every penny!!”

She told me she spent about $375 on the Bali trip and another $225 on a trip to India through this company.

Point.me

Points.me landing page for the concierge service.
Point.me landing page for the concierge service. POINT.ME

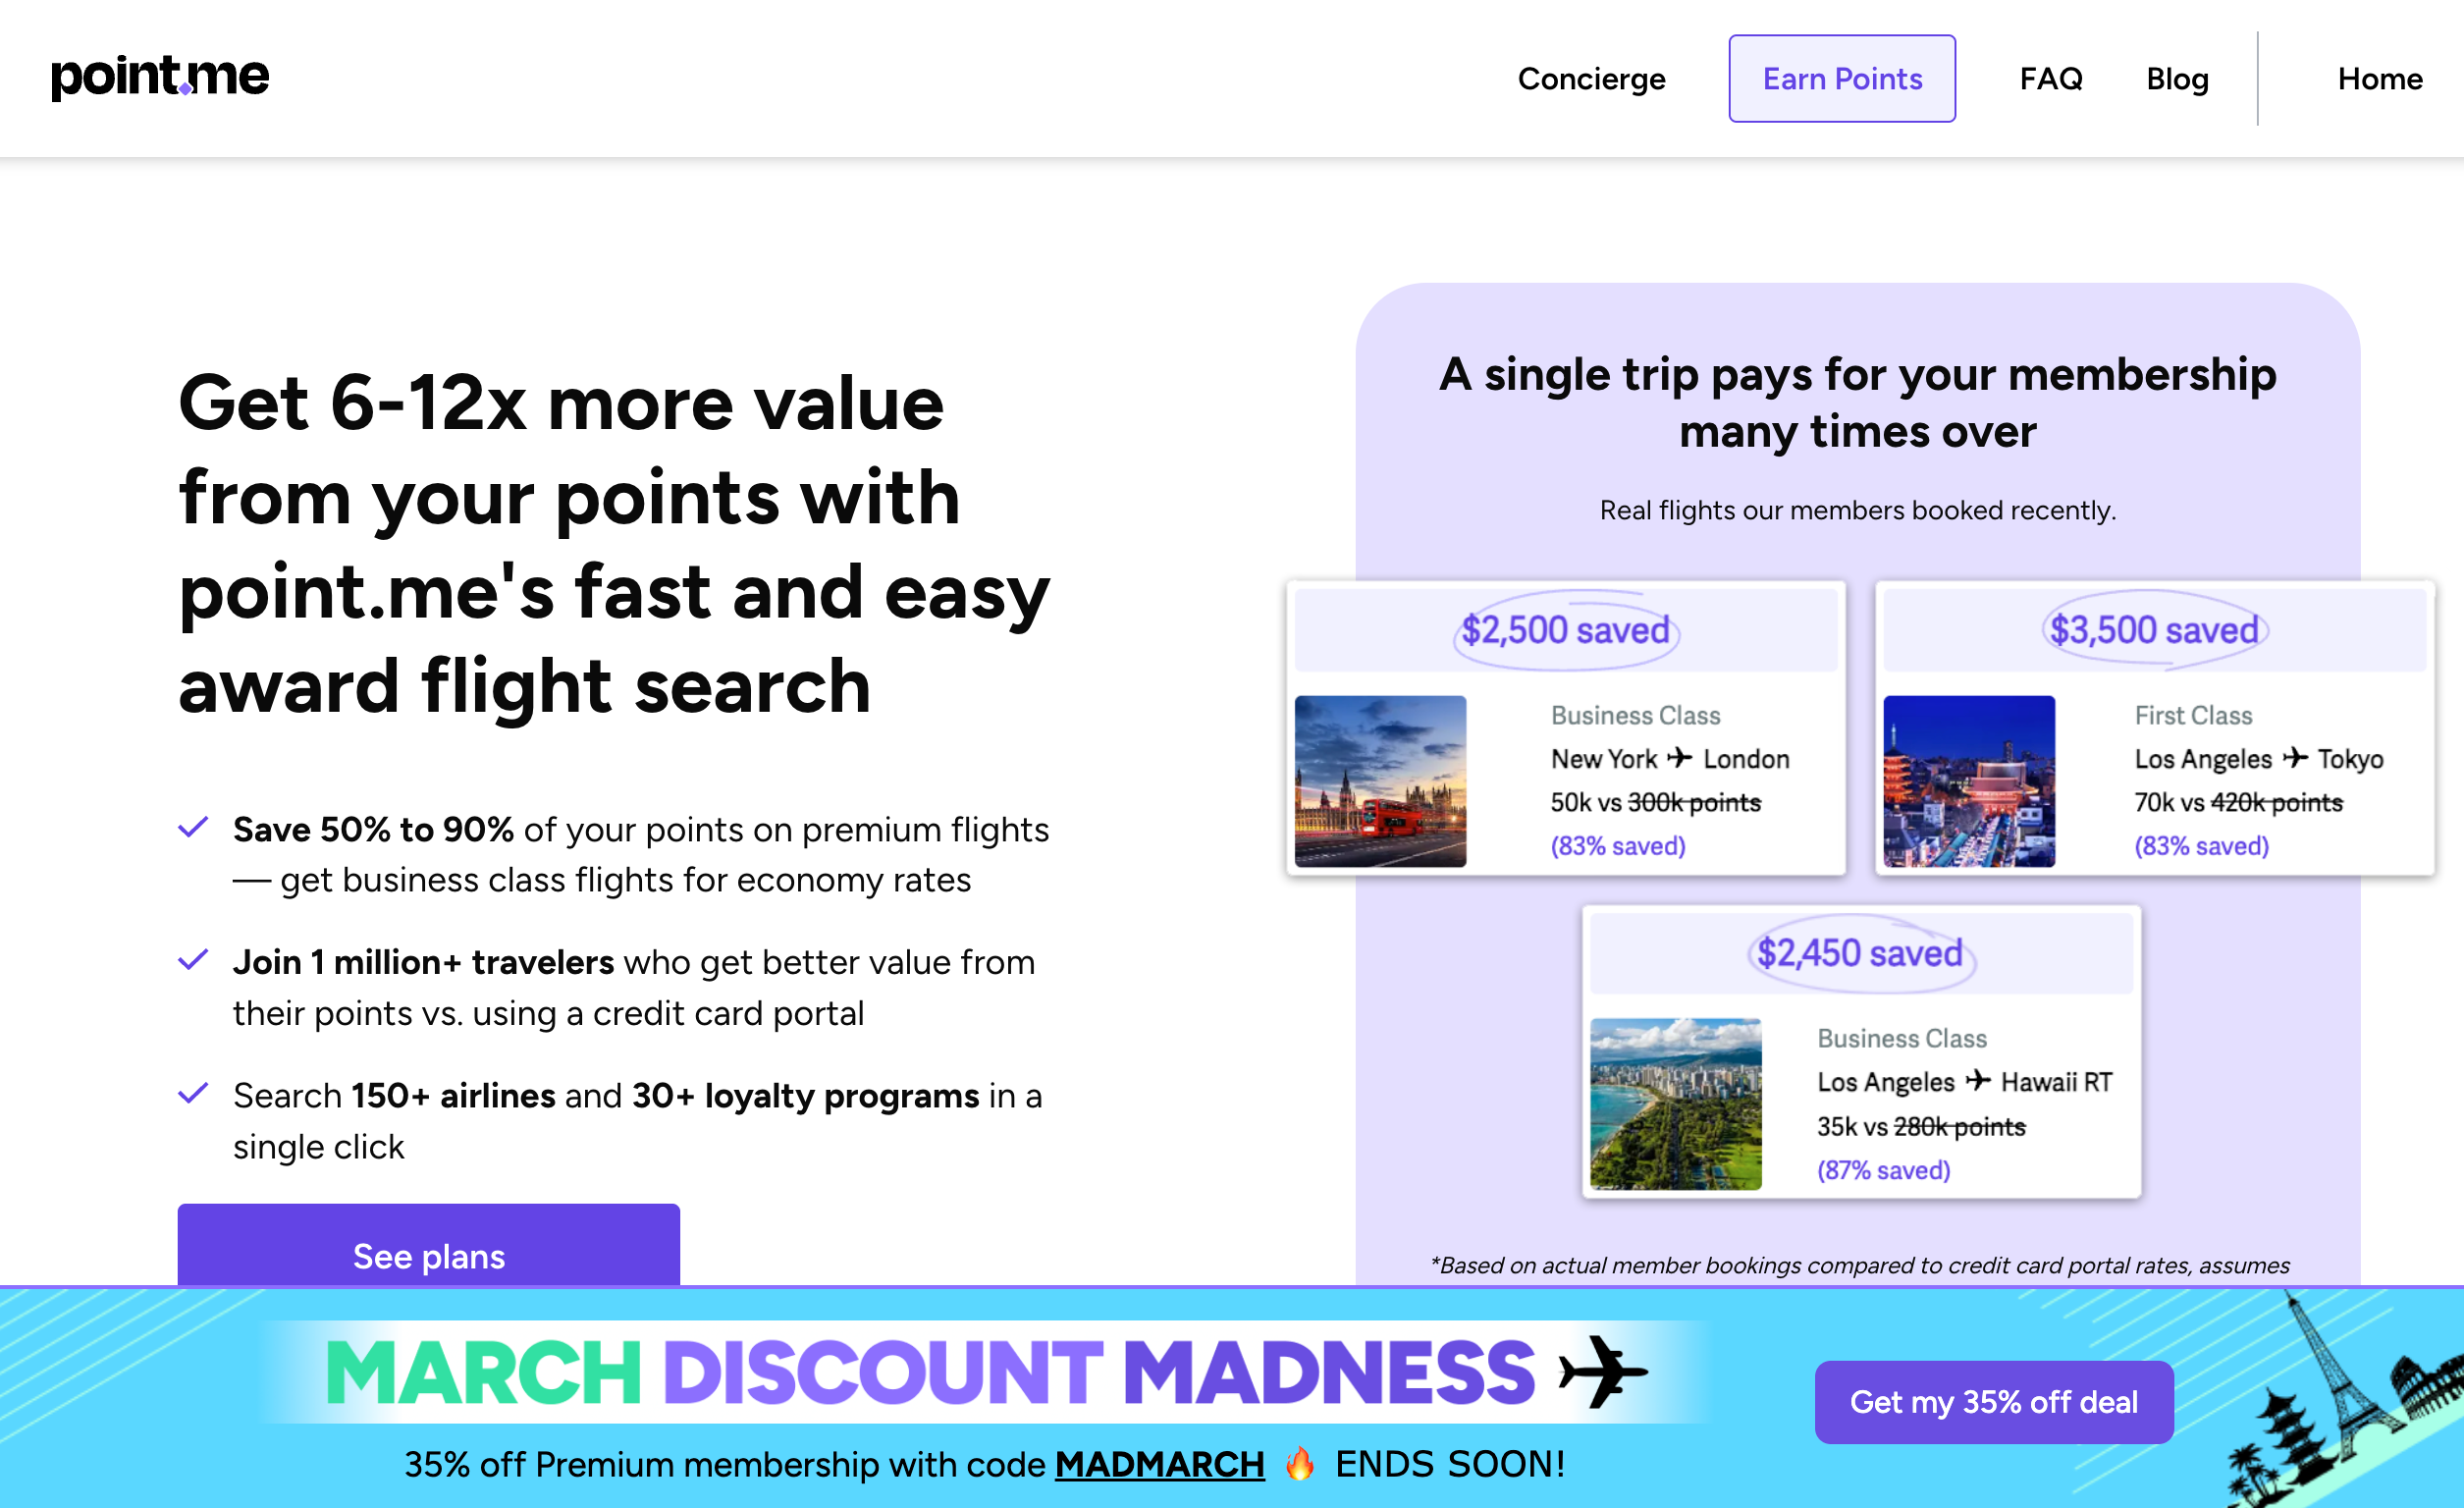
Point.me is another service that many TPGers have used over the years. It features incredible search tools that help find elusive awards, and it also offers a concierge service. You might remember two other services, Juicy Miles and PointsPros, that teamed up with Point.me to offer award bookings.

Reward your inbox with the TPG Daily newsletter

Join over 700,000 readers for breaking news, in-depth guides and exclusive deals from TPG’s experts

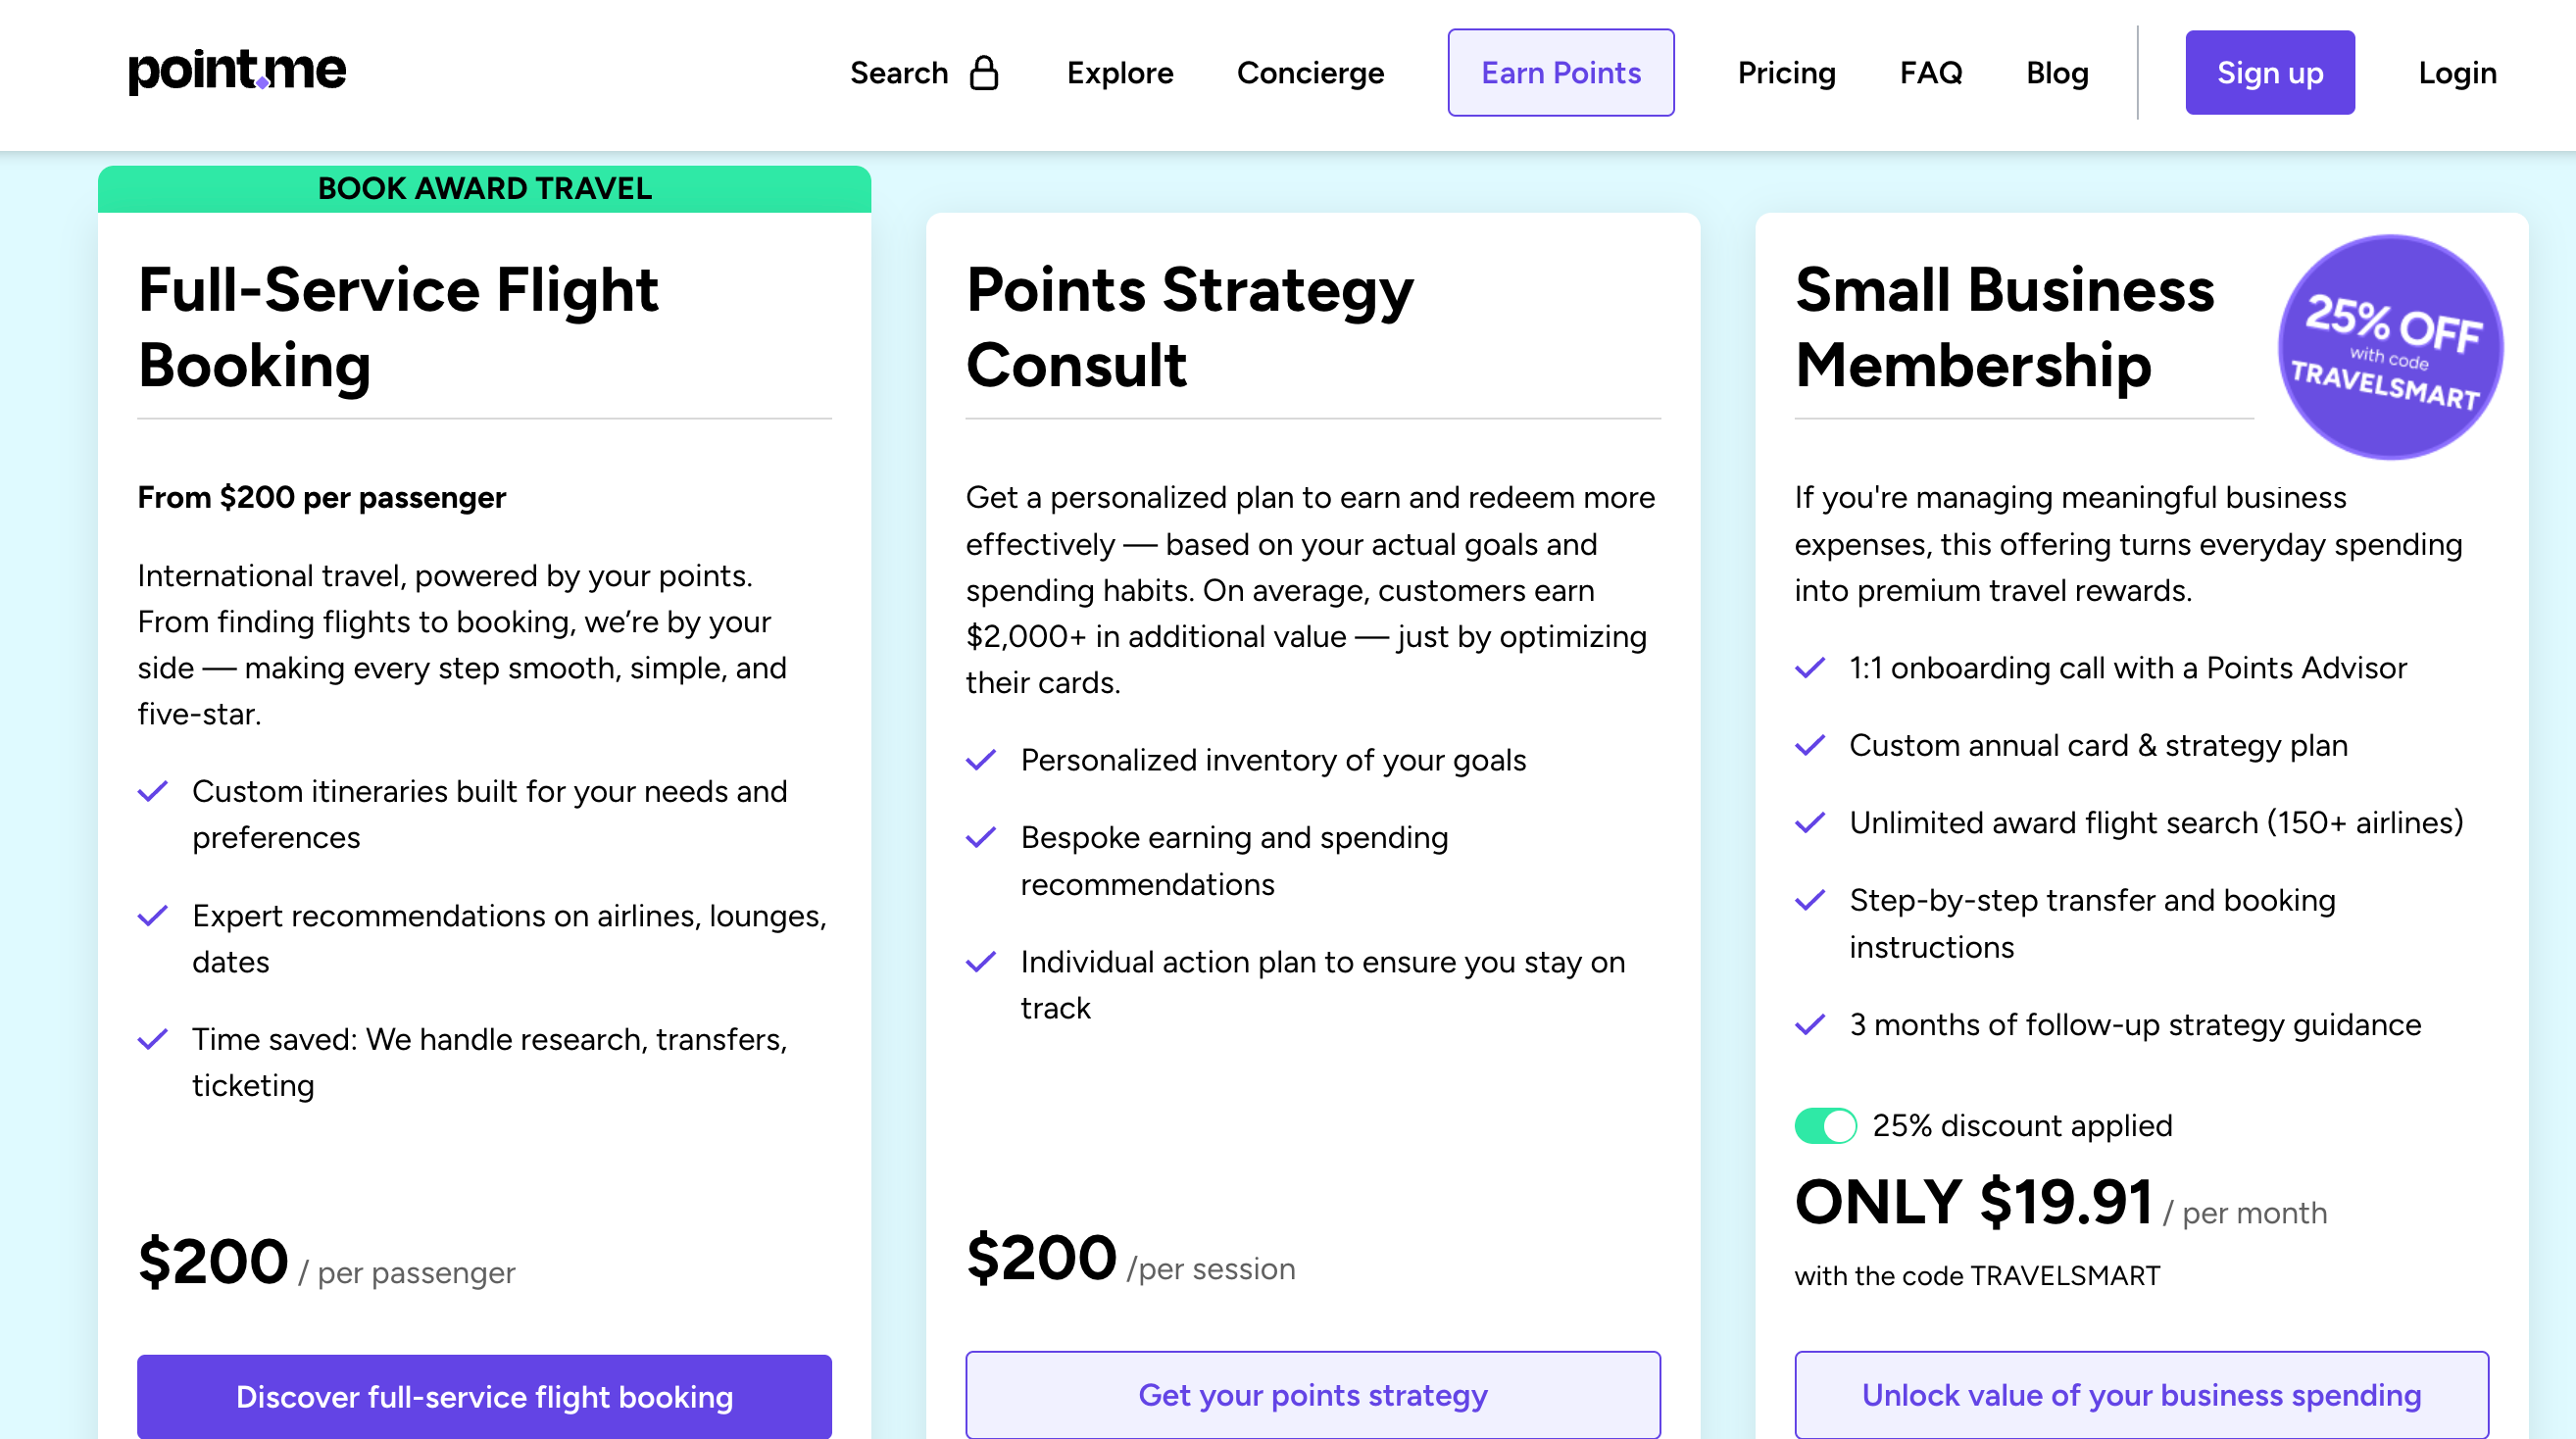
For $200, you can use Point.me’s full-service option for booking flights with miles.

Point.me concierge service pricing. POINT.ME

I have used Point.me to find some incredible flight redemptions, but haven’t had a chance to use its planning features.

“What’s great about our concierge service is the depth of expertise. We’ve been at this for decades now,” Tiffany Funk, co-founder of Point.me, told TPG. “Not only have our team members flown every airline personally, but we also have tons of client experiences to reference, and are able to use our unique data to advise as to what is both possible and practical for your trip.”

Funk also suggested that bargain-hunters subscribe to the company’s Premium service instead. With this option, travelers get a one-on-one points consultation, a 10% discount on concierge services, a $100 annual credit and unlimited access to Point.me’s self-serve tool to both search and set alerts.

TPG reader Jordan Rodriguez told me that he used Point.me for an international business-class booking in December; he said he had an overall good experience as the team helped him book for more than one person with some very specific seating requests using Cathay Pacific Asia Miles and Singapore Airlines KrisFlyer miles. However, he also said there were some communication issues, and he was told Point.me couldn’t help book some very hard-to-find redemptions, like All Nippon Airways business class.

“This service seems best for people who can’t or don’t have the time to do award searches and/or bookings, aren’t sure [how to] best use their points, or have a challenging request,” Rodriguez said.

Another reader, Laura Ratliff, said, “I use Point.me in conjunction with Amex Platinum, and it’s been great. About a month ago, I got VS [Virgina Atlantic] Upper Class JFK-LHR-CDG for 60k Flying Blue miles.”

JetBetter

Landing page for wejetbetter.com.
Landing page for wejetbetter.com. JETBETTER

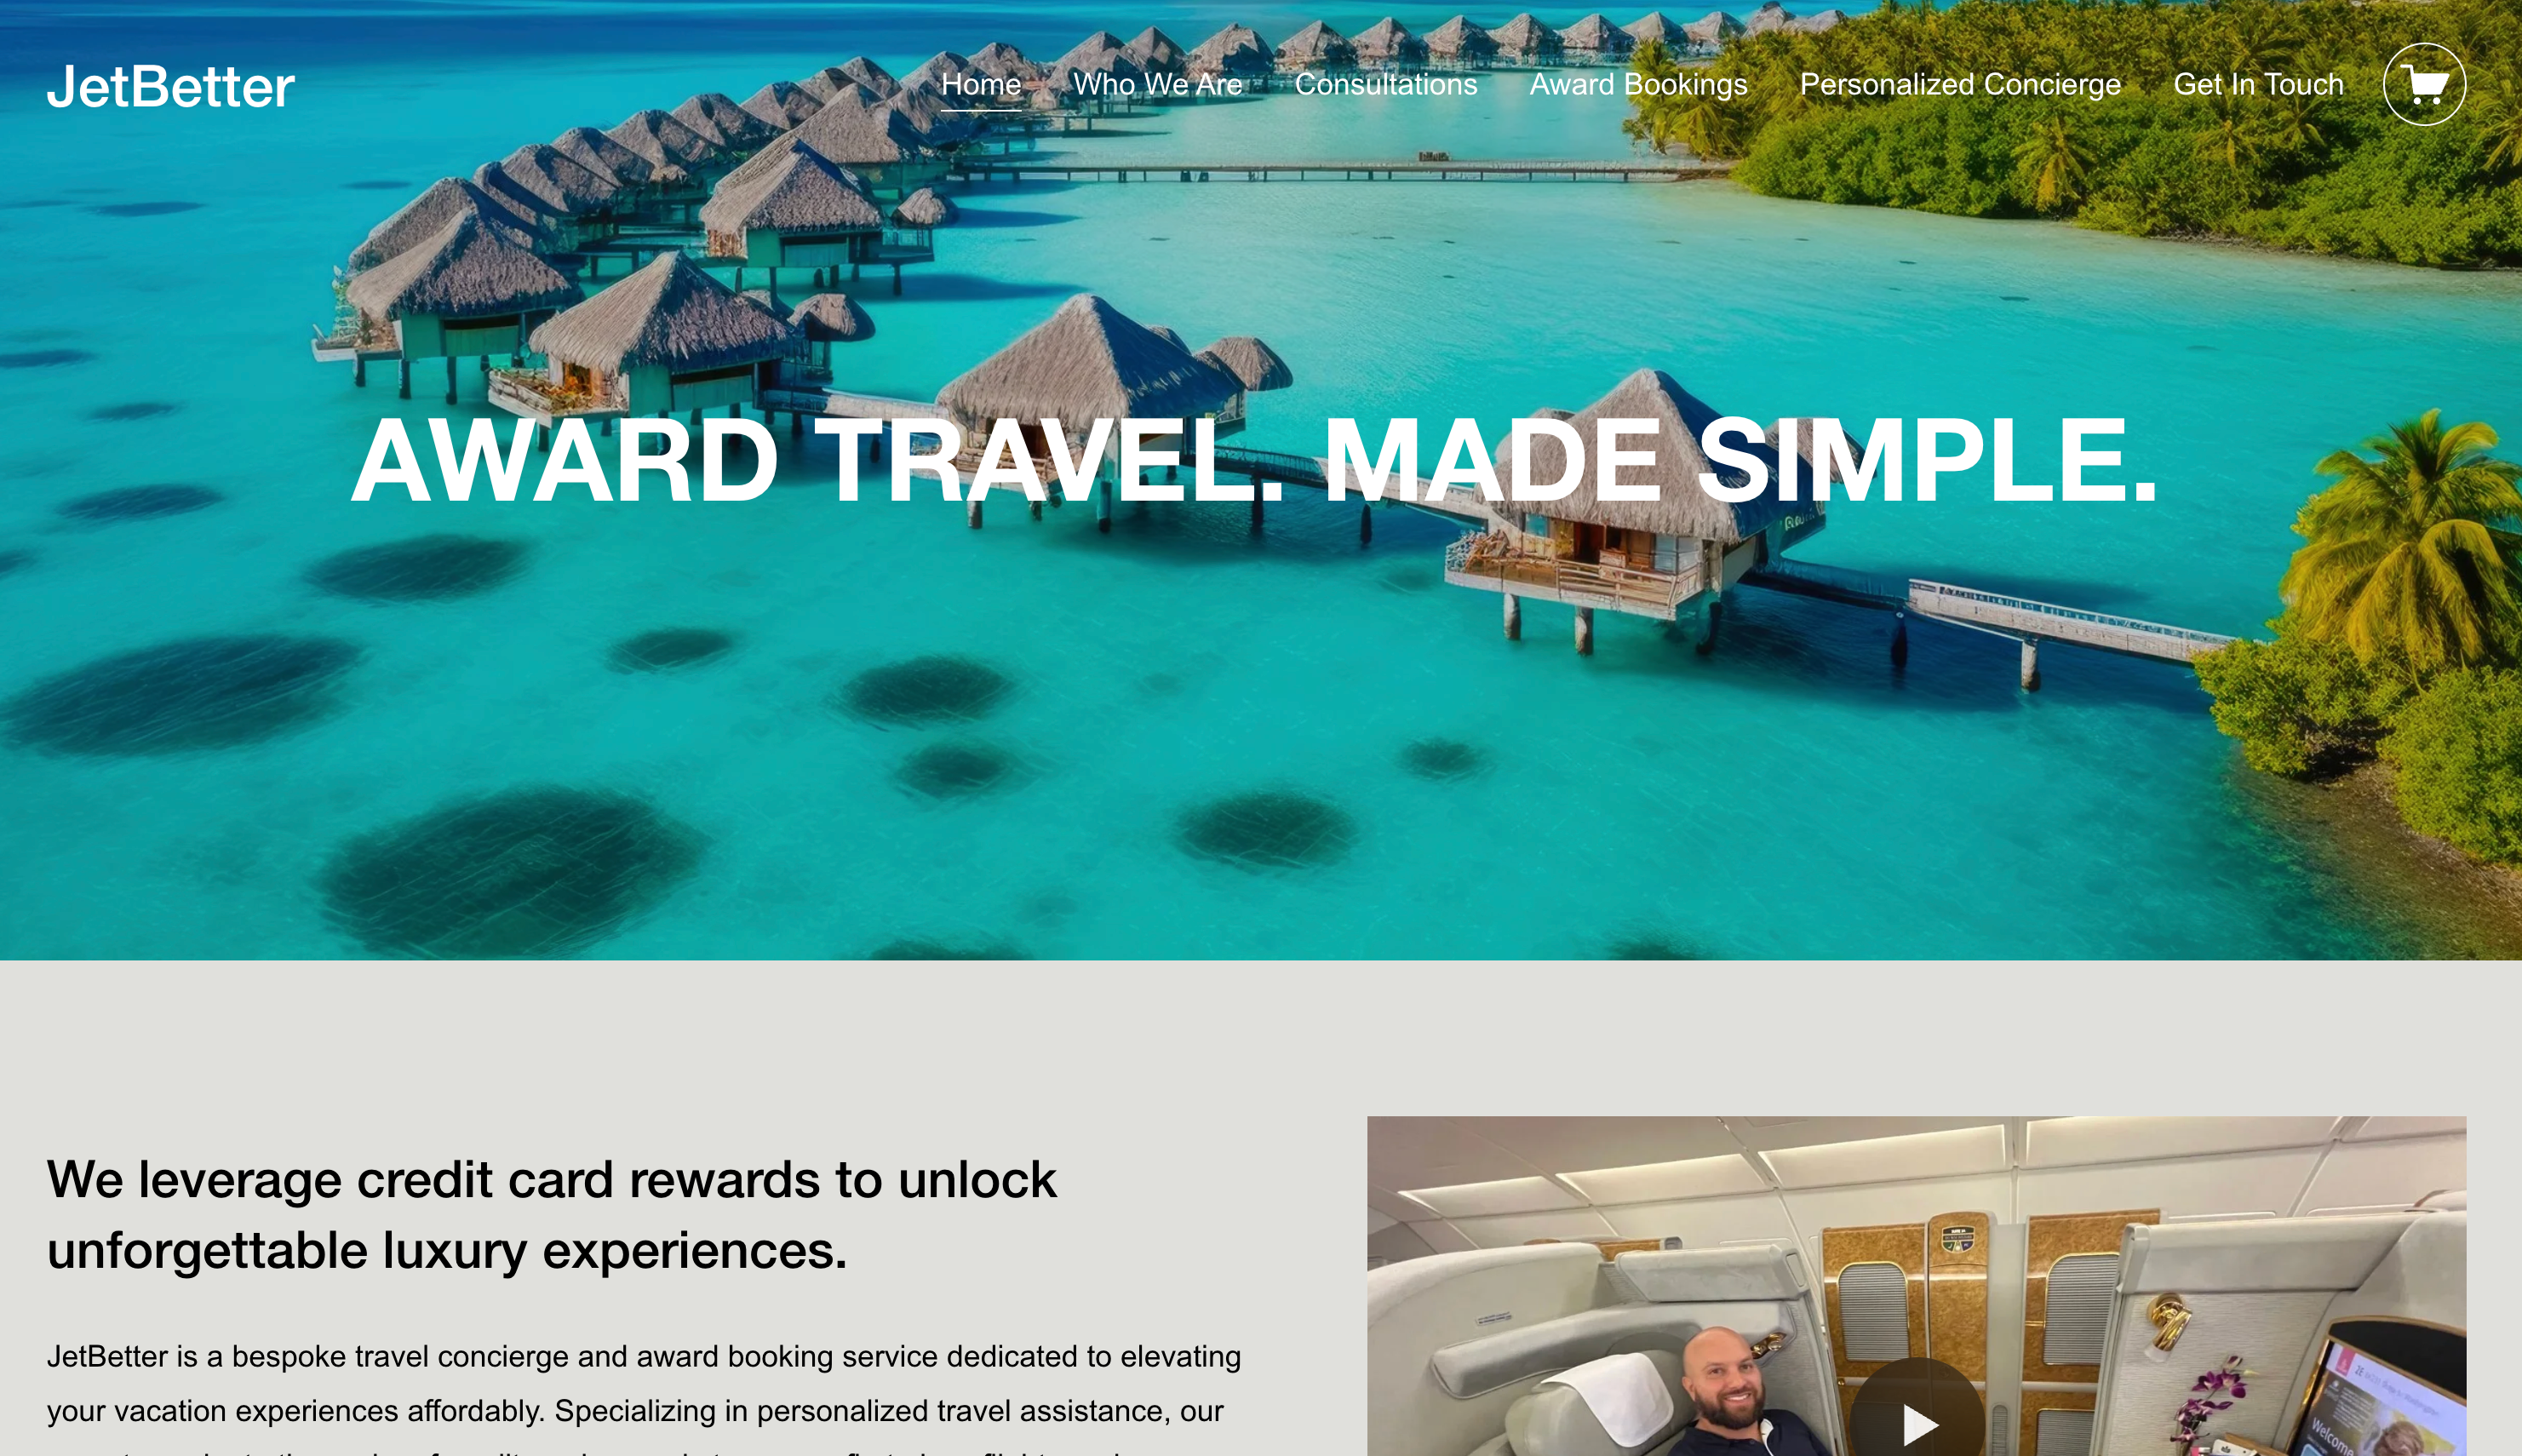
Former TPG contributor Juan Ruiz runs JetBetter, which offers award bookings and consultations. Ruiz’s company helps people book award flights starting at $150 one-way or $250 round-trip. It costs $150 one-way or $200 round-trip for each additional passenger. Multicity itineraries start at $175.

Even if you don’t have points and miles, JetBetter can also help travelers plan full trips and book other add-ons using cash, too.

“Award space is out there — you just need to know where to look,” Ruiz told TPG. “At JetBetter, I personally work with you to find and book high-value award flights, including premium cabins and hard-to-find availability — so you can maximize your points without the hassle.”

Travel on Point(s)

Travel on Point(s) landing page.
Travel on Point(s) landing page. TRAVEL ON POINT(S)

Travel on Point(s) is a blog and a popular Facebook group. It also has a booking service, where users can submit a booking request via an online form. Prices start at around $100 but can go up quickly from there.

“You should be ready to book your flights when you receive your results,” the company warns. “Award flight availability is constantly changing, so don’t make a request now if you won’t be ready to book for a few more weeks. Any space we find will likely be gone by then.”

The website also notes that it charges a nonrefundable $100 search fee or 50% of the total paid, whichever is less. If Travel on Point(s) can’t find any availability that meets a traveler’s criteria, it will provide a full refund minus the nonrefundable search fee.

10xTravel

10xtravel.com award booking page. 10XTRAVEL.COM
10xtravel.com award booking page. 10XTRAVEL

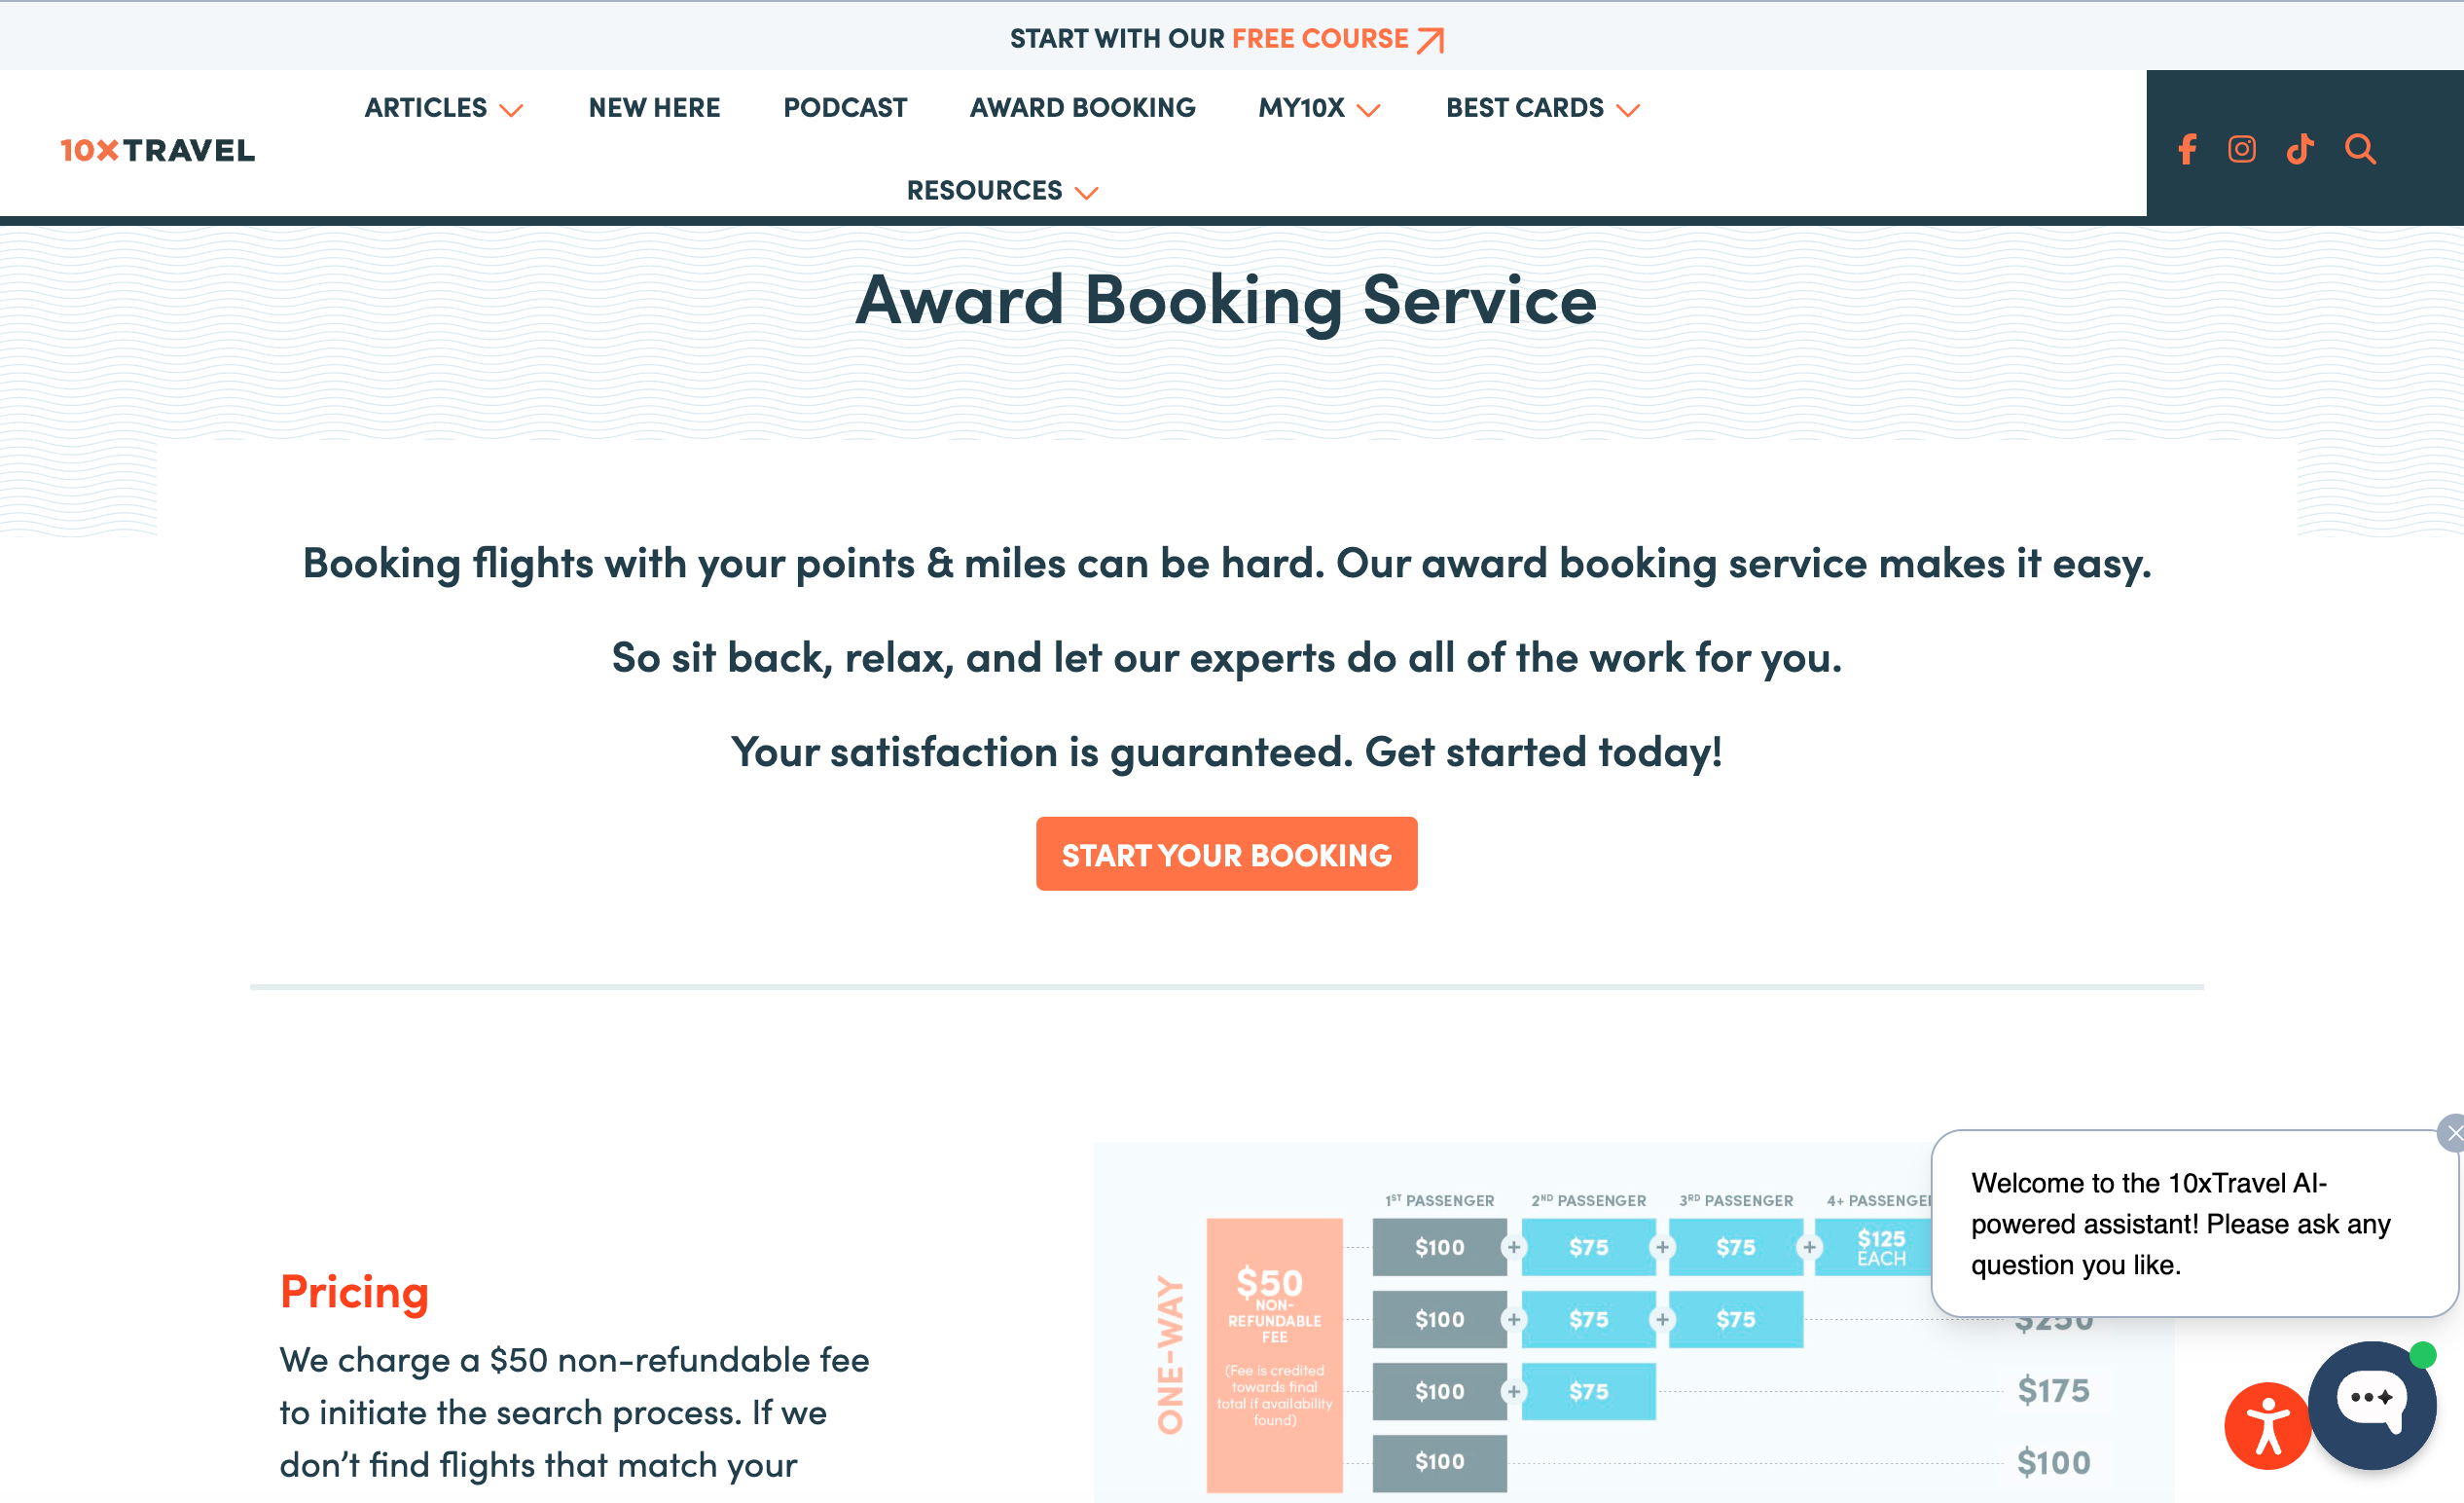
10xTravel helps you find awards, and several TPG readers swear by it. You just fill out an online form and press “Submit.” The company will follow up with you via email.

Unfortunately, it charges a nonrefundable $50 fee to initiate the search, which is frustrating. I couldn’t even tell how much the booking fee would be in the end. I would like to see 10xTravel offer a full quote before charging a nonrefundable fee.

The fee chart is below. If I’m reading it correctly, I would owe $150 for a round-trip booking using my points or miles, plus the $50 booking fee — a total of $200.

10Xtravel pricing chart. 10XTRAVEL.COM
10xTravel pricing chart. 10XTRAVEL

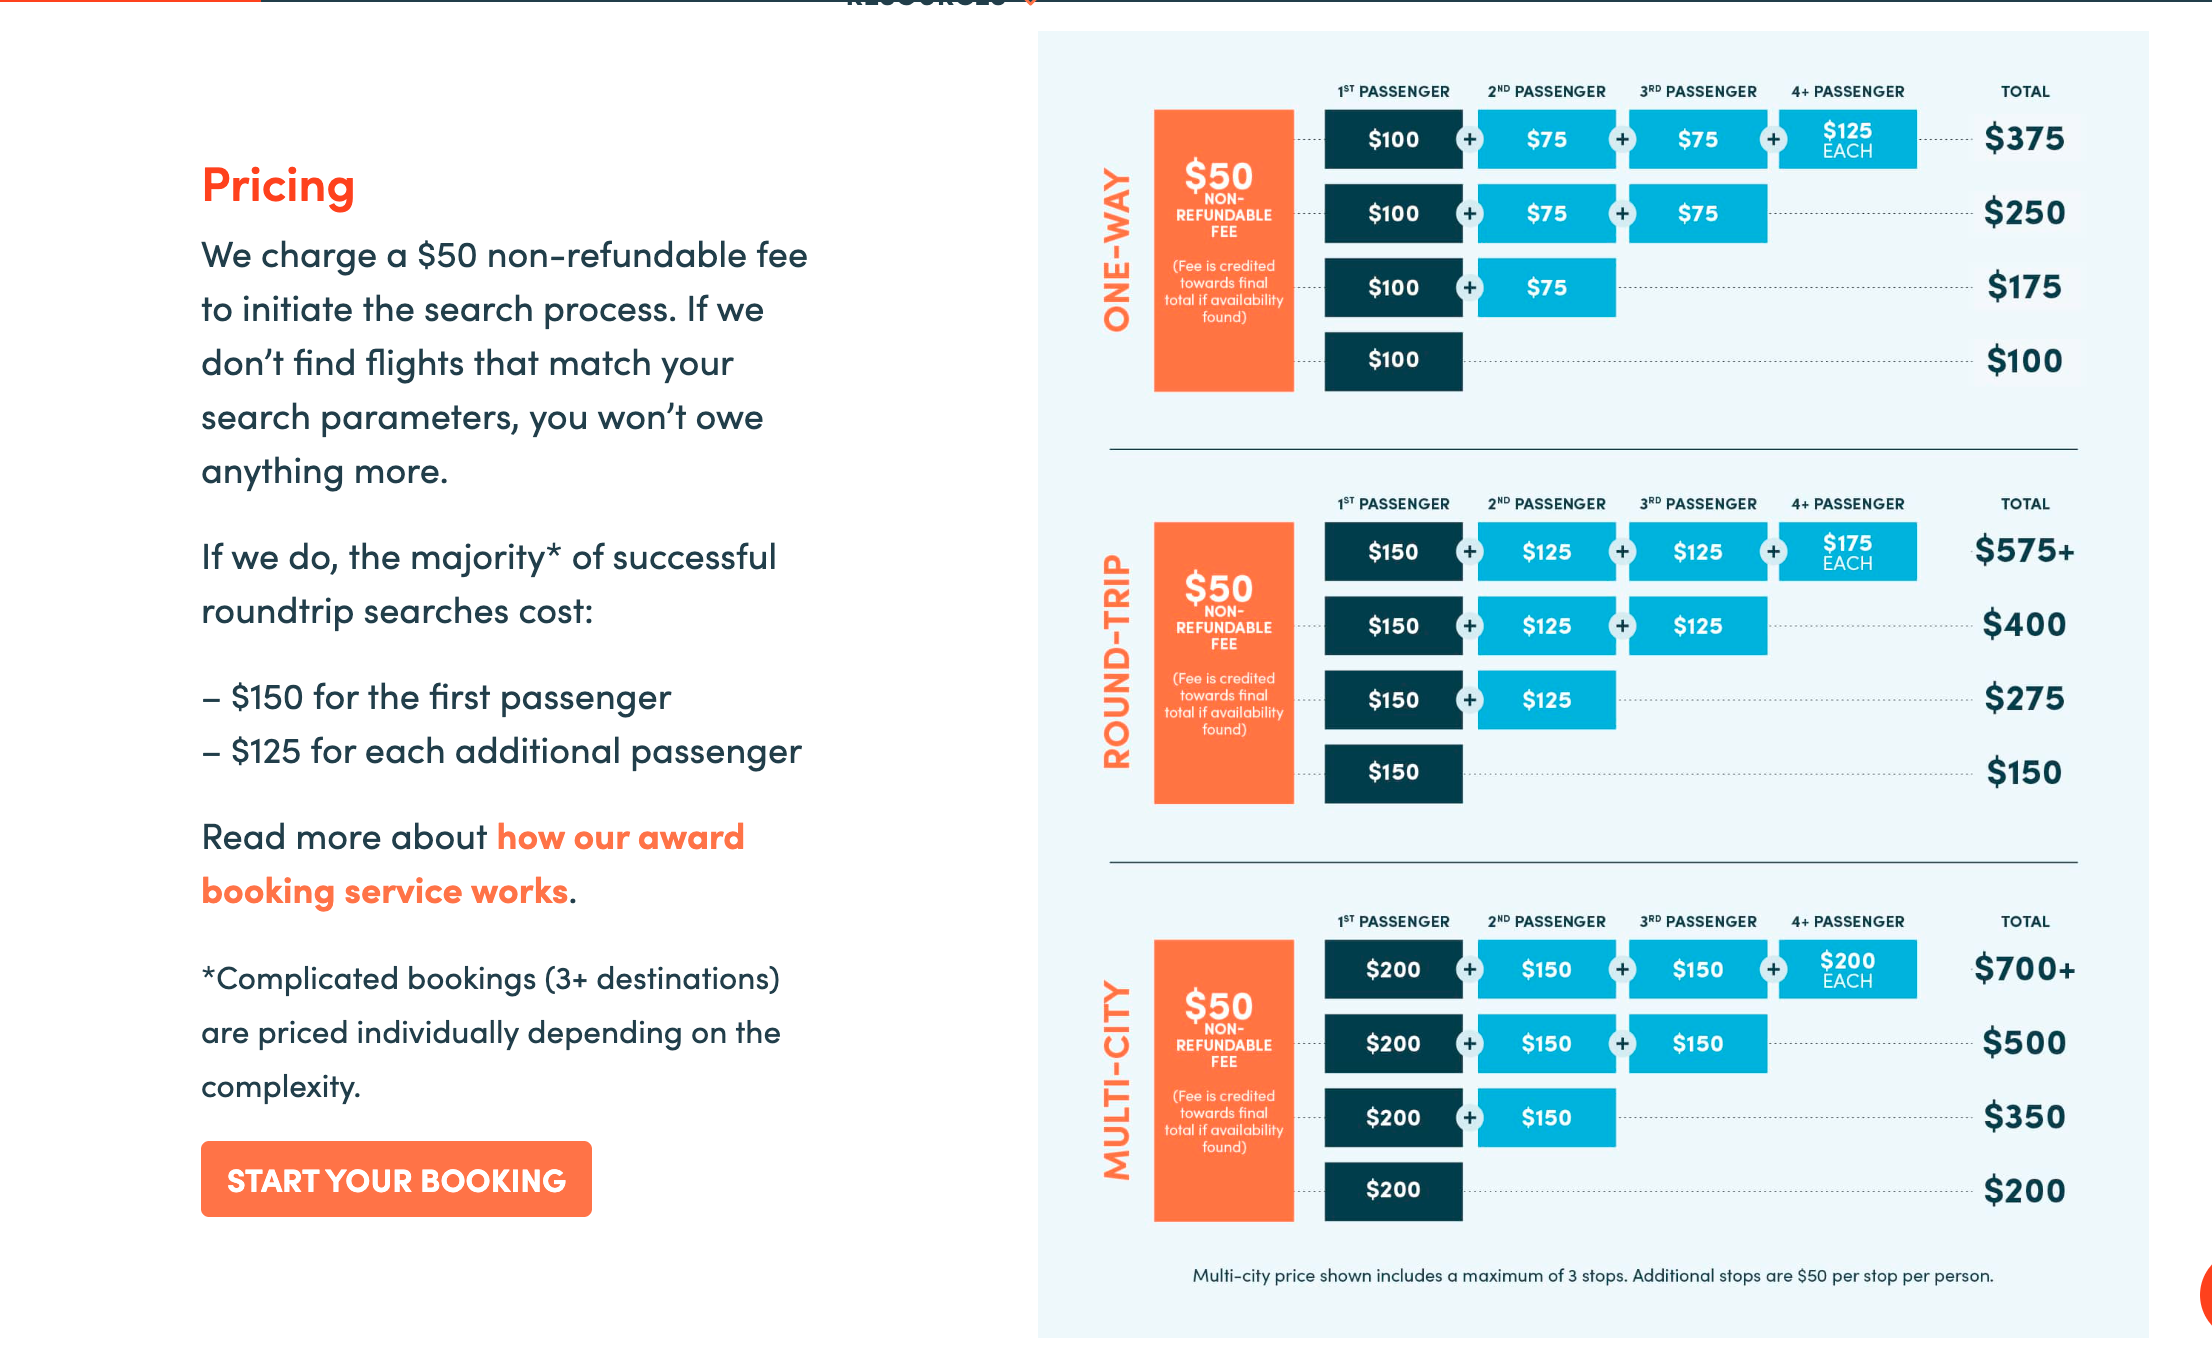
If I didn’t trust myself to find a way to redeem rewards on my own, it might be worth it. However, you can see that for a family of four, the costs could quickly add up.

TPG reader Lynn Richter Lott told me in The Points Guy Facebook group, TPG Lounge, that she has used the service and really liked it: “I’ve used 10xTravel twice. Once for a very complicated itinerary & once for AUS/NZ (hard to get tix).” Another reader named Eve Zucker Strauss said she has also used 10x travel to book award tickets, “They found options I couldn’t and were worth the fee.”

“At 10xTravel, our whole mission is to teach people how to maximize their points and miles themselves, and we love it when they do,” a spokesperson for the company said. “But we also know that finding the perfect award redemption can take hours of expertise that most people simply don’t have on a Tuesday night.”

The spokesperson explained that 10xTravel’s award booking service works for two kinds of people: “those who know their points are valuable but don’t have the time to dig through dozens of transfer partners to find the best use of them, and those who are great at earning points but feel overwhelmed when it’s actually time to redeem.”

Essentially, the service works for people who need a bit of extra help making their first booking to really “see how it all clicks together,” the spokesperson added. “Either way, our experts do the heavy lifting so you can focus on the trip, not the research.”

Bottom line

A view from the newly renovated M Social Downtown in New York City. CLINT HENDERSON/THE POINTS GUY

While TPG doesn’t generally offer individual booking advice to readers, there are plenty of resources that will do the work for you. Of course, TPG has plenty of guides and resources if you are more of a DIY-er.

Here are a few:

But let’s face it, many of us don’t have the time or obsession to make a perfect award booking on our own. Hopefully, these tried-and-true companies can help.

Related reading:


Source link

Leave a Reply

Subscribe to Our Newsletter

Get our latest articles delivered straight to your inbox. No spam, we promise.

Recent Reviews


Alteryx Tools – Table of Content

What is Power BI?  

Power BI is referred to as a Software as a service (SaaS) platform, a Business Intelligence tool that helps analyze organizational data and also helps in creating real-time and interactive dashboards. The Power BI business intelligence tool can be installed on any desktop, mobile or can be used online as well. It also helps in collaborating with every peer in the organization. Power BI is a data visualization tool that helps in developing dashboards and BI reports with business intelligence capabilities. Apart from data visualization, it also allows to perform data exploration, helps in establishing reliable and secure connections to the cloud data sources.

Power BI is used by many organizations because of its amazing features like visualization creation. Some of the visualization formats are column charts, area plots, bar charts, line plots, scatter plots, pie charts, treemaps, scatter plots, etc. It also includes a navigation pane that helps in navigating to the dashboards and reports, associated applications, recent work, etc. The Power BI tool also includes inbuilt functions called DAX functions that can be used for data analysis. These are predefined functions that are available in the library. In Power BI, the data can be imported either from a single or multiple data sources. Power BI is also capable of providing extensive support to both structured and unstructured data. It also includes pre-built templates for dashboard creation. You can also create customized dashboards. 

What is Python?

Python is referred to as a high-level, general-purpose, interpreted programming language that includes a set of pre-built functions and libraries which helps in performing complex operations and calculations. It is easy to learn and is used in most fields like data analytics, artificial intelligence, machine learning, etc. 

Python includes two libraries called Matplotlib and Pandas. Matplotlib library consists of the predefined functions that help in plotting the data visualizations while the pandas library also includes the predefined functions that help in working with the data available.

Become a Power BI Certified professional by learning this HKR Power BI Training !

Power BI Training

  • Master Your Craft
  • Lifetime LMS & Faculty Access
  • 24/7 online expert support
  • Real-world & Project Based Learning

Prerequisites for Power BI Python Integration:

Below is the list of the prerequisites required for Power BI Python Integration to take place.

  1. Python runtime installation: The python runtime installation includes the installation of the execution run time through which the Python script operations can be performed.
  2. Libraries installation: It is essential that some of the important libraries have to be installed which increases the robustness of Power BI. Some of the important libraries are Seaborn and Pandas.
  3. Installation of Visual Studio Code: The installation of Visual Studio code is optional. You can also install any other code editor for writing your python scripts. You can also make use of the Power BI script editor to write the scripts.
  4. Power BI settings update: The final step is to update the settings so that you can work efficiently with Python in Power BI. Through this, you can perform the scripting in Power BI. All you need to do is open up the Power BI desktop, click on the file option. Then click on options followed by settings, then navigate to the opportunities which open a new dialogue box in Power BI. Then you can click on the Python scripting, select the path from the directories and IDE of Python. Once done, you will need to click on the OK button.

Understanding the need for Python Integration in Power BI:

By now, you all might have got an idea of what Power BI and Python is for. Yes, Python is referred to as the powerful tool that helps in creating visualizations while Power BI is for creating well-versed dashboards. These dashboards include all the information which helps in providing a complete view of the organization growth, metrics, KPIs, etc. Hence, if Python and Power BI are integrated, it will be a plus for us to utilize the capabilities that Power BI and Python hold.

Apart from the above, Python and Power BI integration includes several other benefits listed below.

  • The users are allowed to run the python scripts directly within the Power BI
  • Through the integration, libraries like Matplotlib and Seaborn can be used in Power BI for data visualization.
  • Python has become a leading technology and all the machine learning frameworks and data science libraries are written in Python. Through the integration, it allows to create of the data analysis scripts using Power BI
  • To perform precise calculations and clear the complexities, some of the enriched libraries like NumPy and Pandas can be used.

Click here to learn Power BI Tutorial

Power BI Python Integration:

In order to solve complex problems in an organization, it requires data and analytics. It also requires future predictions which gives us future insights and helps us clear the bypass of the issues. Through the business intelligence tools, all these predictions and data visualizations are represented in different forms for a better understanding and analysis. With the amazing capabilities that Power BI and Python hold, organizations are being successful with their integration attaining benefits.

Any idea on how the Power BI Python Integration is performed? Well, I will help with the step by step process to perform the Power BI Python integration.

  • Setup the Integrated Environment:

The primary step is to set up an integrated environment ready for the integration process to begin. You will need to have a distribution of Python readily installed in your machine/desktop. I preferred Anaconda for coding related tasks and the base distribution of Python. Sometimes, trying to integrate Anaconda with Power BI is a difficult task.

After the installation process is completed, you will need to install four python packages, each one has its own significance. They are :

Pandas – for data analysis and data manipulation

Matplotlib and seaborn – for plotting purposes

NumPy – for performing scientific calculations

The pip command in the command line tool is used for installing these packages into the machine.

pip install pandas

pip install matplotlib

pip install NumPy

pip install seaborn

Once the above packages are installed, the python scripting needs to be enabled in Power BI. If you want to check, you can open the Power BI and detect whether the python distribution is automatically detected or not. You will need to go to the files, followed by options and settings, then click on options. You will be able to view the home directory for Python under python scripting that is installed in the machine.

Setup the Integrated Environment

Acquire Vagrant certification by enrolling in the HKR Vagrant Training program in Hyderabad!

  • HKR Trainings Logo

    Subscribe to our YouTube channel to get new updates..!

  • Data Importing using the Python script:

It is time for you to check whether Python is working within Power BI by running a sample test. The primary step to perform this function is to import a small dataset using the Python script in Power BI.

To perform this, you will need to navigate to the Home ribbon, then move to the GetData option and click on the other option. Through this, you will be able to import the data from a different set of sources available. Some of the sources are Spark, Hadoop distributed file system, (HDFS), Web, etc. In the below image, I am going to import the Churn Prediction system that is available in my system.

Data Importing using the Python

Once you click on the connect option, you will see a section that allows you to write the Python script.

Python script

You will need to click on the OK button which will further ask you to select the churn data. Once done, you will need to click on the Load option. You can also perform a check whether the data has been loaded or not through the data view option. With this, you are now ready to make use of the power query in order to perform the data transformations.

Using Power Query To Transform the data:

All the individuals who have learned Python would know that data transformation is no longer a single task-based activity.

By using the Power Query editor, the user can shape and transform the data as required with just a single click. The Power BI is also capable of keeping the record of all the transformations and operations that take place or happen during the process of transformation. We will now show you how to use the Power query to understand and know the data transformation capabilities.

Once the data is loaded in the Power BI, you will need to click on the transform data option which is available under the Home tab in order to open the query editor.

Once the query editor is opened up, you will see multiple options to perform the operations like clean, reshape and transform the data.

Power Query To Transform

We will now convert the customer_nw_category variable into a text field because these fields represent the worth category. Also, you need to know that it would not be a continuous variable.

To perform the same, you will need to select the column -> Go to the Data Type, and change the data type to a text format. All the steps will be recorded by the Power query under the applied steps section. You can also rename these steps for a better recall or reference. I will rename this step as nw_cat Text. The next step is to transform the churn column into a logical variable. True here represents for churned (1), whereas False here represents not churned (2). The step can be renamed as Churn True/False.

customer_nw_category

Once the above operation is performed, you will need to click on the close and apply option which will be available on the top left corner so that all the transformations made will be applied.

Using Python’s Statistical within Power BI:

Power BI is considered a library of visualization. Correlation matrix heatmap is an integral component in the data analysis reports.

We will guide you on how to create a correlation matrix heatmap by making use of the Python correlation function. The created heatmap will be available in the reports section in Power BI.

You will need to navigate to the Report section that is available in the Power BI. Then click on the Py symbol which denotes Python visual which is available under the visualizations section. On the left side, you will see an empty Py along with a Python script editor popping up at the bottom of the screen. By this, you might have understood that Power BI is providing an option to create the visualizations with the scripts.

All the value fields will be empty firstly. For correlation heatmap illustration, all the continuous variables will be brought into the value fields, like the age current, previous month balance, monthly balance items, etc. This is considered one of the most essential steps during the integration process. If you forget to perform this step, the Power BI will not be able to recognize the variables.

As the variables are moved into the values fields, the python script will be automatically populated with the below codes.

Let us also write the code for correlation heatmap creation in Python by using the seaborn package.

# import the charting libraries matplotlib and seaborn

import matplotlib.pyplot as plt

import seaborn as sns

# create the correlation matrix on the dataset

corr = dataset.corr()

# create a heatmap of the correlation matrix

sns.heatmap(corr, cmap="YlGnBu")

# show plot

plt.show()

You can now use the run script button and run the script, which will produce a correlation matrix heatmap.

Python’s Statistical within Power BI

Generating analytical reports:

After the heatmap is generated, we can analyze the heatmap and will come to a conclusion.

With the above heatmap, below are the set of conclusions made:

  1. There is no correlation with the other variables for the number of dependents and age.
  2. There is a moderate correlation observed for the average monthly balance in the time span of the last two quarters.
  3. There is a high correlation between the average monthly balance with the previous month balance and the current month balance in the last quarter.
    It is possible to generate a heatmap for the customers who have churned and you can also compare with the customers that do not have. You can apply the filter of churn = False or True so that the heatmap can be observed. Through the analysis, it helps in deriving useful insights from data analysis to the prediction of the behavior.
  4. Power BI Training

    Weekday / Weekend Batches

Conclusion:

Through this article, you have got a clear idea of the process of integration of Python with Power BI. I hope the above information helps you. To get a clear understanding and in-depth knowledge on the subject, you can get trained and certified in Power BI through the Power BI training. The integrated environment will definitely help the organizations to handle and play with the data as and when needed. It focuses on enhancing the power and capitalizing on the benefits that are available in both tools.

related articles 


Source link