High gas prices strain budgets of hunger relief groups


Two people putting groceries into a vehicle

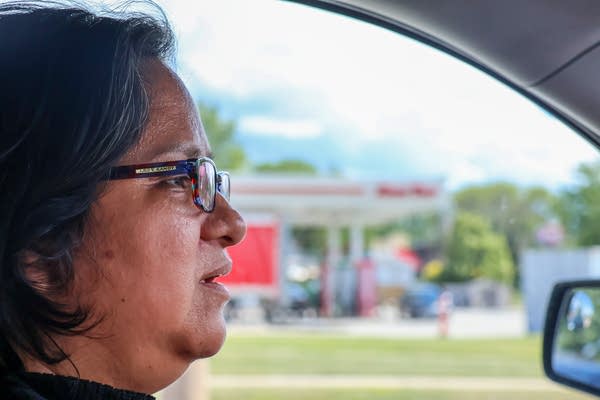
Soaring gasoline prices over the last few months have forced many Minnesotans to make difficult choices, some of them deciding whether to buy food or fill the tank. And while pump prices have eased some in recent weeks from their peak of a statewide average of $4.35 a gallon a month ago, the pump price is still much higher than it was before the start of the war with Iran, leaving many wondering when, if ever, there will truly be relief.

A shopping cart loaded with groceries
A shopping cart loaded with groceries to be delivered to a client of ECHO Food Shelf on June 18. Those without transportation, limited mobility and medical conditions rely on home delivery services the food shelf provides when they can't make it in person.
Hannah Yang | MPR News

This week, the state’s average price for a gallon of regular unleaded gas is hovering around $3.70, which is still below the national average of $3.93 per gallon, according to AAA. But it is still a dollar a gallon more than it was in January.

For those who were already struggling to make ends meet, the spike in gas prices since the beginning of the war with Iran further strains their household budgets.

“People usually tend to cut on their food expenses before they cut back on anything else, so that's kind of one of the first things that goes,” said Deisy De Leon Esqueda, director of ECHO Food Shelf in Mankato. “And then after that, it’s maybe like their prescription drugs or gas.”

“[Gas prices have] risen, but like you have to get to work,” Esqueda added. “So there’s really no other option besides that.”

A person loading up a vehicle with groceries
Deisy De Leon Esqueda, ECHO Food Shelf manager loads up her car to make a delivery in rural Blue Earth County on June 18.
Hannah Yang | MPR News

That has increased the need for people to rely on food shelves like ECHO to help stock their fridges and put food on their tables. But the rising cost of gasoline and diesel fuel is also beginning to strain the budgets of these nonprofit groups that help feed people across Minnesota.

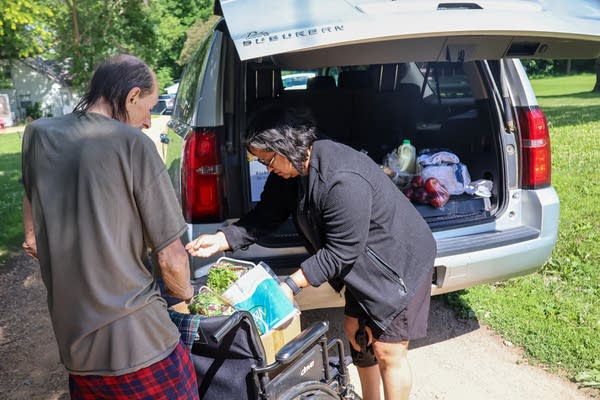
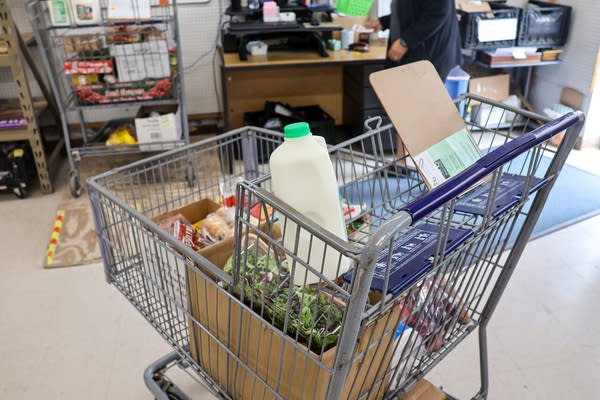
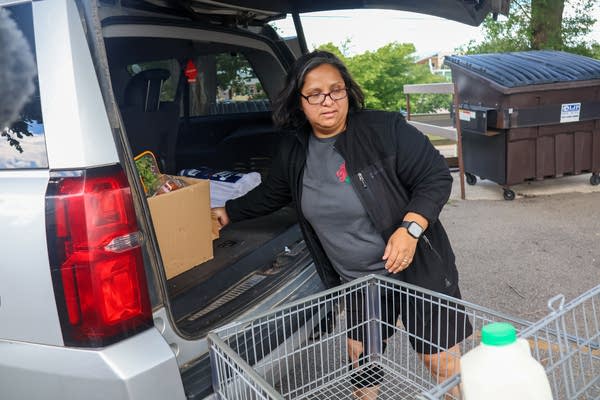
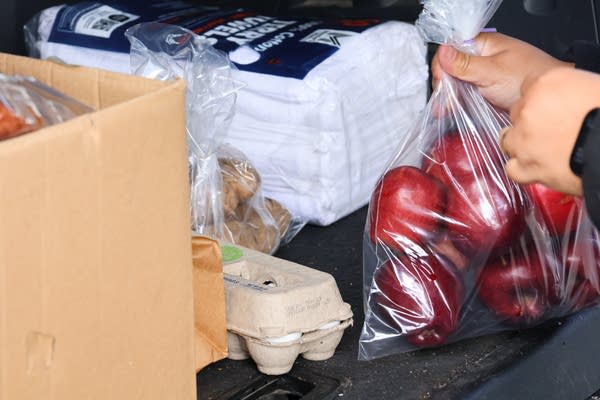
ECHO Food Shelf has a grocery delivery service called ECHO Delivers. It relies on volunteers to deliver food packages and other essentials to those who physically can’t come into the food shelf themselves.

A person putting groceries in a vehicle
Deisy De Leon Esqueda, manager of ECHO Food Shelf, loads up her car with groceries and other necessities to make a home delivery on June 18.
Hannah Yang | MPR News

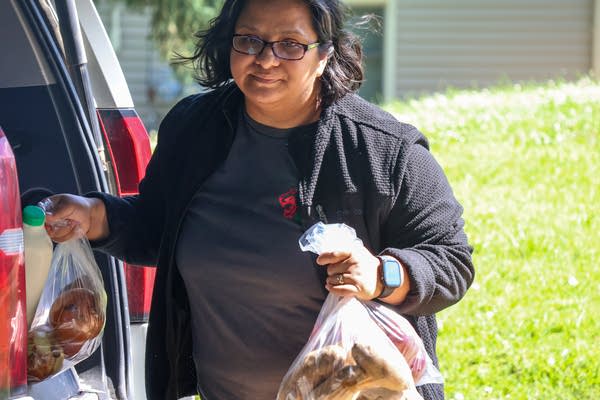
“People that are on Echo Delivers typically have had some type of surgery or [they’re] not, are not able to get around,” said Esqueda, while delivering some groceries to a client herself. “Or maybe they're not driving anymore, or just have very limited mobility, and, and that's where we come in.”

Bruce Piltz is one of those volunteer drivers. The 73-year old from Mankato started volunteering to deliver groceries for ECHO about eight months ago.

“It’s essential,” Piltz told MPR News. “Grocery prices are so high, and so by being able to deliver to people who can’t [and] don’t have transportation, or simply can’t get out, we’re able to help them get by every month.”

Piltz makes his deliveries on Tuesdays and said he’s on-call when needed. And he said he covers a wide area of rural Blue Earth County.

A woman driving
Gas prices are dropping, but the last few months of high costs put a strain on volunteers who make deliveries and also clients who are choosing between fuel or food. Deisy De Leon Esqueda says food is often the first thing people cut from their budget in able to afford gas to commute to work.
Hannah Yang | MPR News

“I've been over as far as Faribault, I've been over to St. James in that Madelia surrounding area, so I've got a range,” Piltz said.

Piltz receives gas vouchers from ECHO Food Shelf to help reimburse him for his gas and mileage costs, and he said he personally is OK with absorbing some of the extra expenses for making those deliveries. But he said the rising costs aren’t unnoticed, and he’s needed to cut back on other days to save money.

“I realized something had to give,” Piltz said. “What that meant was doing less driving (on other days). Plus, when I did go out and run errands or go shopping, I’ve always tried to schedule three or four stops on one outing, that way I can conserve on gas.”

Hunger relief groups feeling the strain

Minnesotans made more than 9 million food shelf visits in 2025, a record number, according to The Food Group, a Twin Cities-based hunger relief nonprofit. And the demand isn’t slowing down, as the organization expects this year will be the fifth year in a row that the number of food shelf visits in the state sets a new record.

Already feeling that strain from the increasing demand for their services, which has been compounded by federal budget cuts to the Supplemental Nutrition Assistance Program, or SNAP, hunger relief organizations are now feeling the impact of higher gas prices on their budgets.

Sophia Lenarz-Coy, executive director of The Food Group, said the nonprofit fuel costs have soared 23 percent since the beginning of the year. In January, the organization’s fuel costs were $3,877 per month and by May, it had jumped almost $1,000 a month, to $4,783.

Lenarz-Coy said The Food Group’s third-party carriers also charged higher fuel surcharges. One vendor they used to pay 25 percent as a surcharge got bumped up to 45 percent.

A person holding groceries
Deisy De Leon Esqueda, manager of ECHO Food Shelf, delivers groceries to rural clients in Judson, Minn. who aren’t able to make it to the food shelf in person on June 18.
Hannah Yang | MPR News

“These added costs are getting baked in at different levels of the food supply chain,” Lenarz-Coy said. “We are starting to see our third-party carriers and vendors increase their delivery fees to us. We’re not doing that right now to our partners, but that is just kind of added cost pressure that’s showing up.”

Other hunger relief nonprofits are also feeling the pinch in sourcing food and reimbursing their volunteers too. Toni Scott, chief supply chain officer at Second Harvest Heartland, said the fuel costs have increased nearly 25 to 40 percent just from January through March of this year, and that was before gas prices peaked in mid-May.

These increased prices may also affect the variety of food visitors to their local food shelf might see. Scott said to reduce transportation costs, they shifted to source more of their produce from local and regional farms and orchards. Last year nearly 12 million pounds of produce came from about 130 Minnesota growers.

“We’re hoping that it does stay more of a short term issue,” Scott said. “It’s something that we’ve been able to manage. Should pricing like this continue in the long term, we would have to look more closely at our overall budget to make sure that we are not impacting the amount of food into the community, but looking for other ways to offset the pressures coming from those price increases.”


Source link

Leave a Reply

Subscribe to Our Newsletter

Get our latest articles delivered straight to your inbox. No spam, we promise.

Recent Reviews


How to open the Power BI service?

The following steps need to be followed to open the Power BI service.

Assuming the left route sheet is imploded, select the nav sheet symbol to grow it.

1. Select Learn and look down to Sample reports. Here is some example information to use for our visit through the Power BI administration. There is a wide range of test information given to you to investigate. This time, we’ll utilize the information about the open-door examination.

2. Select the sample to open it. The Opportunity examination test report begins in the Power BI administration.

3. The Power BI administration introduces the example in your My work area. My work area is your private sandbox for learning and testing. No one but you can see the substance in My work area. Select My work area to see insights concerning this example report.

The example incorporates one report and one dataset. Regularly, business clients will not get datasets, yet this example is intended for all clients, and it includes one.

As a business client, most happy that you are imparted will exclude direct admittance to the hidden datasets. Since the Power BI tests are made for all Power BI clients, datasets are incorporated.

Become a Power BI Certified professional by learning this HKR Power BI Training !

View content (dashboards and reports) :

Content is coordinated inside the setting of a work area. Each business client has no less than one work area, and it’s called My work area. At the point when originator partners share satisfaction with you, you might wind up with extra work areas. For instance, assuming an originator doles out your access consents to one of their work areas, that work area will appear on your Power BI site.

My work area stores all the substances that you own and make. Consider it your sandbox or workspace for your meaning. My work area stays void for some Power BI business clients because your occupation doesn’t include making new happy. Business clients, by definition, consume information created by others and utilize that information to pursue business choices. Assuming you observe that you are making content, consider perusing the Power BI articles for report makers.

A work area is significantly more than an essential posting of content. You can gain some significant experience with the work area’s dashboards and reports on this page.

In this segment of the instructional exercise, we’ll put the Opportunity examination test to the side for some time and take a gander at a work area with both a dashboard and a report. On the off chance that you might want to track, look down to the lower-left corner of the Power BI administration and select Get information > Samples > Sales and Marketing Sample > Connect. Resume My Work area to see your new satisfaction.

A work area is one of the ways into your information. You can open a dashboard or report from a work area by choosing it from the rundown. You can most love a dashboard or report by floating and selecting the star symbol. Assuming that the originator gave you sharing authorizations, you can share from here too.

We should begin by opening a dashboard.

1. Select the name of the dashboard to open it.

2. The dashboard opens in the Power BI administration. Dashboards are something that separates the Power BI administration from Power BI Desktop. Find out about dashboards.

3. The moves you can make on a dashboard are shown in the top menu bar. Select More activities (…) to see the total rundown.

4. The visuals on the dashboard are organized as tiles. Float over a dashboard tile and select More choices (…) to see your options for associating with that tile.

5. Select a dashboard tile to open the report utilized to make that tile. The report extends to the page containing the visual on the tile. Here, I’ve chosen the dashboard tile with the treemap. The Power BI administration opens the YTD Category report page.

Reports have a few areas. On the left is the interactive rundown of report pages. Across the top is the menu bar containing moves you can make with the report. The choices accessible will rely upon the job and authorization the reported architect allocated to you. On the right side is the Filters sheet. Also, the middle material contains the actual report. Like the dashboard, there are moves that you can make for the whole piece, for unique visuals and a solitary report page.

Power BI Training

  • Master Your Craft
  • Lifetime LMS & Faculty Access
  • 24/7 online expert support
  • Real-world & Project Based Learning

Using the left navigation pane :

The nav sheet will be more valuable as associates share satisfaction with you. In this part of the instructional exercise, we’ll take a gander at a dashboard and report that have a place with a Power BI business client who has a ton of shared content.

1. Home is the default greeting page when you sign in to the Power BI administration. Home is an excellent leaping-off point and substitute method for exploring your substance. Content on Home is coordinated in a few distinct ways: by suggested, top choices, later, and applications. The Getting begun area is handy for new clients, with tabs containing tests, documentation, and preparing content. Select a thing to open it.

Home unites the looking and arranging instruments, the nav sheet, and material with cards that you can choose to open your dashboards, reports, and applications. You probably won’t have many cards on your Home material from the outset. However, that will change as you utilize Power BI with your partners. Your Home material likewise refreshes with suggested content and learning assets.

2. Favorites and Recent both have bolted. Select a bolt to see the leading five top picks or five most recently visited content rapidly from the flyout, and select a substance to open it.

Select the word or symbol to see your complete rundown of top choices or recent ones. These substance records give insights into the reports, applications, and dashboards.

See Recents in Power BI and Favorites in Power BI to find out additional.

3. Select Apps to show all applications that have been imparted to you or introduced. Also, select Shared with me to see dashboards and reports imparted to you. These substance regions will be unfilled since you’re simply beginning with the Power BI administration.

Top 50 frequently asked Power BI Interview Questions !

HKR Trainings Logo

Subscribe to our YouTube channel to get new updates..!

Search and sort content :

Whenever you’re new to the Power BI administration, you’ll have a couple of bits of content. As associates start offering a range to you and you start downloading applications, you might wind up with extensive arrangements of content. That is the point where you’ll see looking and arranging incredibly accommodating.

Search is accessible from pretty much all aspects of the Power BI administration. Search for the hunt box or search amplifying glass symbol.

In the Search field, type all or part of the name of a dashboard, report, exercise manual, application, or proprietor. Power BI looks through the entirety of your substance.

There are likewise numerous ways of arranging content. Drift over segment headers and search for bolts showing that the section can be set. Not everything segments can be arranged.

Or on the other hand, search for the Search Filters close to the upper right corner of your substance records. Observe content rapidly by sifting for things like kind of satisfied or proprietor.

Filters

Steps to Create a Quick Report

In the Power BI service’s navigation pane, click the Create button to open a page where you can choose your data source. It’s also available from the New report button on the Home page.

create-entry-point

We currently only support creating a report based on an existing dataset or directly typing or pasting data into a table. Other sources, such as uploading an Excel file, will become available over time.

create-source-options

If you choose to type or paste data, you are presented with a grid into which you can begin typing. You can also use Ctrl + V or the context menu to paste data.

create-enter-data-window

Columns can be added and removed using the context menu. Select Use first row as headers if your pasted data contains a header row to promote the first row to the header row automatically. Power BI detects data types automatically, but you can also set them manually. Next to the column name, click the Data type button.

change-data-type

Power BI creates a new dataset for you and autogenerates a summarised view of your data as you go through the creation process. These automatically generated visuals get you from raw data to insights faster than ever before.

select-data-fields-generate-new-visuals

Altering the data in the report is also simple. To add or remove fields from the information, use the Your data pane. Select and deselect areas to change what you want to measure and analyze. Power BI generates meaningful charts based on your field selection.

Want to know more about Power BI,visit here Power BI Tutorial !

Power BI Training

Weekday / Weekend Batches

Conclusion :

Power BI documentation highlights some crucial steps in the complete tutorial or learning of power BI. These steps are straightforward to follow, and Microsoft has released several e-books to document them. If you have any queries, please write back to us.

Related Article :


Source link