Power BI Datasets | Complete Guide on Power BI Datasets


Power BI Datasets – Table of Content

What is Power BI?

Power BI is a set of software services, apps, and connectors that work together to turn disparate data sources into coherent, visually immersive, and interactive insights. Your data could be in the form of an Excel spreadsheet or a hybrid data warehouse that is both on-premises and cloud-based. Power BI makes it simple to connect to your data sources, visualize and uncover what matters, and share your findings with whomever you choose.

 Become a Power BI Certified professional by learning this HKR Power BI Training !

What are Datasets in Power BI?

A dataset is a data collection that you can connect to or import. Power BI allows you to connect to and import all kinds of datasets, allowing you to put everything together in one place. Dataflows can also be used for sourcing the data for Datasets. Workspaces are associated with datasets, and a single dataset can be used in multiple workspaces.
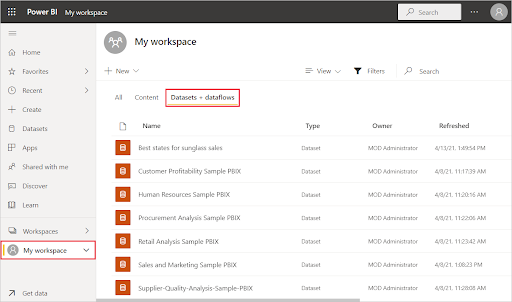
We have selected “My workspace” and then the “Datasets + dataflows” tab in the example below

Power BI workspace

Let us now look into the different types of Datasets in Power BI.

Types of Datasets

Datasets in Power BI are ready to report and visualize the source of data. There are five different types of datasets, each of which can be constructed in one of the following ways:

  • An existing data model will be connected that is not hosted in a Power BI capability.
  • Power BI Desktop file needs to be uploaded which includes a model.
  • Uploading a CSV (comma-separated values) file, or uploading an Excel workbook (Includes one or more Excel tables and/or a workbook data model).
  • Creating a push dataset using the Power BI service.
  • Creating streaming or dataset with hybrid streaming using the Power BI service.

Let us now explore different types of Datasets.

1) External-hosted models

Azure Analysis Services and SQL Server Analysis Services are the two types of externally hosted models. Installing the on-premises data gateway, whether on-premises or VM-hosted infrastructure-as-a-service (IaaS), is required to connect to a SQL Server Analysis Services model. A gateway isn’t required for Azure Analysis Services.

When there are existing model investments, such as those that form part of an enterprise data warehouse(EDW), connecting to Analysis Services makes sense. By utilizing the identity of the Power BI report user, Power BI can establish a live connection to Analysis Services, enforcing data permissions. Both tabular models and multidimensional (cubes) are supported by SQL Server Analysis Services. A live connection dataset sends queries to externally hosted models, as demonstrated in the accompanying 

External-hosted models

2) Power BI Desktop-developed models

A model can be created using Power BI Desktop, a client application for Power BI development. The model is essentially a tabular Analysis Services model. Models can be created by importing data from dataflows and blending it with data from external sources. While the characteristics of how modeling can be accomplished are outside the subject of this article, it’s crucial to note that Power BI Desktop supports three different types, or modes, of models. We are going to discuss the datasets in the coming sections.

Row-Level Security (RLS) can be used in externally hosted models and Power BI desktop models to restrict the amount of data that can be obtained for a certain user. Users in the Salespeople security group, for instance, can only see report data for the sales region(s) to which they’ve been assigned. Roles in RLS can be either static or dynamic. Static roles apply the same filters to all users allocated to the position, whereas dynamic roles filter by the report user.

3) Excel workbook models

The creation of a model is automatic when datasets are created from Excel workbooks or CSV files. To construct model tables, Excel tables, and CSV data are imported, and an Excel workbook data model is translated to produce a Power BI model. In every scenario, data from a file is imported into a model.

4) Push Dataset

A Power BI dataset that can only be created and populated using the Power BI API is known as a push dataset. However, the lack of a good user interface for creating a push dataset restricted its adoption to scenarios where a single table was inhabited with real-time data streaming.

5) Hybrid Streaming Dataset

Real-time streaming in Power BI allows you to stream data and update dashboards in real-time. Real-time data and visuals can be displayed and updated in any Power BI visual or dashboard. Factory sensors, social media sources, service usage metrics, and a variety of other time-sensitive data collectors or transmitters can all be used to collect and transmit streaming data.

Hybrid Streaming Dataset

Want to know more about Power BI,visit here Power BI Tutorial !

Power BI Training

  • Master Your Craft
  • Lifetime LMS & Faculty Access
  • 24/7 online expert support
  • Real-world & Project Based Learning

How to Create a Power BI Dataset?

Before discussing the steps of creation. It is necessary to know that there are three basic ways to retrieve data in Power BI Desktop that you will use to create your visualizations:

1) Live:

Here you will be connecting to a server that carries all the data. Although no data is sent, the model’s metadata is imported into Power BI Desktop. A query is transmitted to the server when you build visualizations, and it is then executed. The outcomes are then visualized and returned to Desktop. With SQL Server Analysis Services (SSAS) models, whether multidimensional or Tabular, live connections are commonly employed. Power BI Desktop behaves like any other thin client in this scenario, like Excel or Reporting Services (SSRS). It is not possible to make major modifications to the model, but you can add new measurements that will be available in that  .pbix file.

2) DirectQuery:

You can make more modifications to the model here than you can with a Live connection. The data is kept on the server, and queries are run on the server, just like in Live. The Power BI Desktop model, for instance, allows for the creation of relationships.

3) Import:

Power Query queries are used to import the data into a Power BI Desktop file (.pbix). The data is compressed highly so it’s feasible to load records in millions into a file on your system. A model, comparable to an SSAS Tabular model, is built behind the scenes. This is the most versatile mode, as it allows you to blend data from any source. However, all data must be loaded into your model, which can take a long time to refresh.

Now, let’s move to create the dataset. Below are the steps which make you comprehend the creation of the Power BI Dataset.

1) A dataset is connected to the .pbix file where it was created one by one. When you first launch PBI Desktop, click “Get Data” to create a new dataset.

Get Data

Alternatively, you can choose a source from the dropdown menu as shown below:

dropdown menu

2) Let’s assume we imported a few tables from the WideWorldImporters SQL Server sample database (The .pbix file can be downloaded here). The tables and their relationships are visible in the Model view:

.pbix file downloaded

3) You can view the actual data of one table at a time in the “Data view”.

Data view

4) You can create, view, and interact with visualizations built on top of the data and model in the “Report view”. 

Report view

 The dataset is made up of the data as well as the model view. Now, let’s move to the different modes of Dataset available in Power BI.  

[ Related Article : msbi ]

HKR Trainings Logo

Subscribe to our YouTube channel to get new updates..!

Dataset modes in the Power BI

These modes of Dataset in Power BI ascertain whether or not data is imported into the model or retained in the data source. The following are the three Dataset modes in Power BI:

  1. Import
  2. DirectQuery
  3. Composite
1) Import

The most popular mode for developing datasets is the import mode. Because of in-memory querying, this mode provides incredibly quick performance. Modelers can also benefit from design flexibility and support for certain Power BI service capabilities (Quick Insights, Q&A, etc.). It’s the default mode when developing a new Power BI Desktop solution because of these advantages.

It’s crucial to realize that all imported data is saved on disk. When the data is refreshed or queried, it should be fully loaded into the memory of Power BI. Import models can yield very rapid query results once they are in memory. It’s also crucial to note that there’s no such thing as a partially loaded Import model in memory. An Import model can also integrate data from any number of supported data source types. The following image illustrates it. 

Import model

2) DirectQuery

Import mode can be replaced by DirectQuery mode. Data is not imported into models created in DirectQuery mode. Instead, they are made up entirely of metadata that defines the model’s structure. If the model is queried, data is retrieved by using the native queries from the underlying data source.

DirectQuery Model

3) Composite

The composite mode can blend DirectQuery and Import modes, or integrate multiple data sources for DirectQuery. The storage mode for every model table can be configured for models created in Composite mode. Calculated tables (defined with DAX) can also be used in this mode.

Composite Model

Import and DirectQuery modes are used in composite models to give you the best of both modes. They can blend the high query performance of in-memory models with the capacity to access near real-time data from data sources when set properly.

Top 50 frequently asked Power BI Interview Questions

Power BI Training

Weekday / Weekend Batches

 Conclusion:
We have successfully learned that Power BI lets you connect various datasets for importing and bringing them all together in one place. In this blog, we explored the topics of Datasets in Power BI in a systematic flow by understanding Power BI, then Datasets in Power BI, different types of Datasets and models used for reporting and visualizing data, creating a Dataset for connecting files, and various modes of Datasets in Power BI.

Related Article:

  1. MSBI vs Power BI
  2. Looker vs Power BI
  3. KPI in Power BI
  4. DAX In Power BI
  5. Power BI Architecture
  6. Power BI Components
  7. Power BI Dashboard
  8. Power BI Data Modeling
  9. Power BI Documentation


Source link

Leave a Reply

Subscribe to Our Newsletter

Get our latest articles delivered straight to your inbox. No spam, we promise.

Recent Reviews


Alteryx Tools – Table of Content

What is Power BI?  

Power BI is referred to as a Software as a service (SaaS) platform, a Business Intelligence tool that helps analyze organizational data and also helps in creating real-time and interactive dashboards. The Power BI business intelligence tool can be installed on any desktop, mobile or can be used online as well. It also helps in collaborating with every peer in the organization. Power BI is a data visualization tool that helps in developing dashboards and BI reports with business intelligence capabilities. Apart from data visualization, it also allows to perform data exploration, helps in establishing reliable and secure connections to the cloud data sources.

Power BI is used by many organizations because of its amazing features like visualization creation. Some of the visualization formats are column charts, area plots, bar charts, line plots, scatter plots, pie charts, treemaps, scatter plots, etc. It also includes a navigation pane that helps in navigating to the dashboards and reports, associated applications, recent work, etc. The Power BI tool also includes inbuilt functions called DAX functions that can be used for data analysis. These are predefined functions that are available in the library. In Power BI, the data can be imported either from a single or multiple data sources. Power BI is also capable of providing extensive support to both structured and unstructured data. It also includes pre-built templates for dashboard creation. You can also create customized dashboards. 

What is Python?

Python is referred to as a high-level, general-purpose, interpreted programming language that includes a set of pre-built functions and libraries which helps in performing complex operations and calculations. It is easy to learn and is used in most fields like data analytics, artificial intelligence, machine learning, etc. 

Python includes two libraries called Matplotlib and Pandas. Matplotlib library consists of the predefined functions that help in plotting the data visualizations while the pandas library also includes the predefined functions that help in working with the data available.

Become a Power BI Certified professional by learning this HKR Power BI Training !

Power BI Training

  • Master Your Craft
  • Lifetime LMS & Faculty Access
  • 24/7 online expert support
  • Real-world & Project Based Learning

Prerequisites for Power BI Python Integration:

Below is the list of the prerequisites required for Power BI Python Integration to take place.

  1. Python runtime installation: The python runtime installation includes the installation of the execution run time through which the Python script operations can be performed.
  2. Libraries installation: It is essential that some of the important libraries have to be installed which increases the robustness of Power BI. Some of the important libraries are Seaborn and Pandas.
  3. Installation of Visual Studio Code: The installation of Visual Studio code is optional. You can also install any other code editor for writing your python scripts. You can also make use of the Power BI script editor to write the scripts.
  4. Power BI settings update: The final step is to update the settings so that you can work efficiently with Python in Power BI. Through this, you can perform the scripting in Power BI. All you need to do is open up the Power BI desktop, click on the file option. Then click on options followed by settings, then navigate to the opportunities which open a new dialogue box in Power BI. Then you can click on the Python scripting, select the path from the directories and IDE of Python. Once done, you will need to click on the OK button.

Understanding the need for Python Integration in Power BI:

By now, you all might have got an idea of what Power BI and Python is for. Yes, Python is referred to as the powerful tool that helps in creating visualizations while Power BI is for creating well-versed dashboards. These dashboards include all the information which helps in providing a complete view of the organization growth, metrics, KPIs, etc. Hence, if Python and Power BI are integrated, it will be a plus for us to utilize the capabilities that Power BI and Python hold.

Apart from the above, Python and Power BI integration includes several other benefits listed below.

  • The users are allowed to run the python scripts directly within the Power BI
  • Through the integration, libraries like Matplotlib and Seaborn can be used in Power BI for data visualization.
  • Python has become a leading technology and all the machine learning frameworks and data science libraries are written in Python. Through the integration, it allows to create of the data analysis scripts using Power BI
  • To perform precise calculations and clear the complexities, some of the enriched libraries like NumPy and Pandas can be used.

Click here to learn Power BI Tutorial

Power BI Python Integration:

In order to solve complex problems in an organization, it requires data and analytics. It also requires future predictions which gives us future insights and helps us clear the bypass of the issues. Through the business intelligence tools, all these predictions and data visualizations are represented in different forms for a better understanding and analysis. With the amazing capabilities that Power BI and Python hold, organizations are being successful with their integration attaining benefits.

Any idea on how the Power BI Python Integration is performed? Well, I will help with the step by step process to perform the Power BI Python integration.

  • Setup the Integrated Environment:

The primary step is to set up an integrated environment ready for the integration process to begin. You will need to have a distribution of Python readily installed in your machine/desktop. I preferred Anaconda for coding related tasks and the base distribution of Python. Sometimes, trying to integrate Anaconda with Power BI is a difficult task.

After the installation process is completed, you will need to install four python packages, each one has its own significance. They are :

Pandas – for data analysis and data manipulation

Matplotlib and seaborn – for plotting purposes

NumPy – for performing scientific calculations

The pip command in the command line tool is used for installing these packages into the machine.

pip install pandas

pip install matplotlib

pip install NumPy

pip install seaborn

Once the above packages are installed, the python scripting needs to be enabled in Power BI. If you want to check, you can open the Power BI and detect whether the python distribution is automatically detected or not. You will need to go to the files, followed by options and settings, then click on options. You will be able to view the home directory for Python under python scripting that is installed in the machine.

Setup the Integrated Environment

Acquire Vagrant certification by enrolling in the HKR Vagrant Training program in Hyderabad!

  • HKR Trainings Logo

    Subscribe to our YouTube channel to get new updates..!

  • Data Importing using the Python script:

It is time for you to check whether Python is working within Power BI by running a sample test. The primary step to perform this function is to import a small dataset using the Python script in Power BI.

To perform this, you will need to navigate to the Home ribbon, then move to the GetData option and click on the other option. Through this, you will be able to import the data from a different set of sources available. Some of the sources are Spark, Hadoop distributed file system, (HDFS), Web, etc. In the below image, I am going to import the Churn Prediction system that is available in my system.

Data Importing using the Python

Once you click on the connect option, you will see a section that allows you to write the Python script.

Python script

You will need to click on the OK button which will further ask you to select the churn data. Once done, you will need to click on the Load option. You can also perform a check whether the data has been loaded or not through the data view option. With this, you are now ready to make use of the power query in order to perform the data transformations.

Using Power Query To Transform the data:

All the individuals who have learned Python would know that data transformation is no longer a single task-based activity.

By using the Power Query editor, the user can shape and transform the data as required with just a single click. The Power BI is also capable of keeping the record of all the transformations and operations that take place or happen during the process of transformation. We will now show you how to use the Power query to understand and know the data transformation capabilities.

Once the data is loaded in the Power BI, you will need to click on the transform data option which is available under the Home tab in order to open the query editor.

Once the query editor is opened up, you will see multiple options to perform the operations like clean, reshape and transform the data.

Power Query To Transform

We will now convert the customer_nw_category variable into a text field because these fields represent the worth category. Also, you need to know that it would not be a continuous variable.

To perform the same, you will need to select the column -> Go to the Data Type, and change the data type to a text format. All the steps will be recorded by the Power query under the applied steps section. You can also rename these steps for a better recall or reference. I will rename this step as nw_cat Text. The next step is to transform the churn column into a logical variable. True here represents for churned (1), whereas False here represents not churned (2). The step can be renamed as Churn True/False.

customer_nw_category

Once the above operation is performed, you will need to click on the close and apply option which will be available on the top left corner so that all the transformations made will be applied.

Using Python’s Statistical within Power BI:

Power BI is considered a library of visualization. Correlation matrix heatmap is an integral component in the data analysis reports.

We will guide you on how to create a correlation matrix heatmap by making use of the Python correlation function. The created heatmap will be available in the reports section in Power BI.

You will need to navigate to the Report section that is available in the Power BI. Then click on the Py symbol which denotes Python visual which is available under the visualizations section. On the left side, you will see an empty Py along with a Python script editor popping up at the bottom of the screen. By this, you might have understood that Power BI is providing an option to create the visualizations with the scripts.

All the value fields will be empty firstly. For correlation heatmap illustration, all the continuous variables will be brought into the value fields, like the age current, previous month balance, monthly balance items, etc. This is considered one of the most essential steps during the integration process. If you forget to perform this step, the Power BI will not be able to recognize the variables.

As the variables are moved into the values fields, the python script will be automatically populated with the below codes.

Let us also write the code for correlation heatmap creation in Python by using the seaborn package.

# import the charting libraries matplotlib and seaborn

import matplotlib.pyplot as plt

import seaborn as sns

# create the correlation matrix on the dataset

corr = dataset.corr()

# create a heatmap of the correlation matrix

sns.heatmap(corr, cmap="YlGnBu")

# show plot

plt.show()

You can now use the run script button and run the script, which will produce a correlation matrix heatmap.

Python’s Statistical within Power BI

Generating analytical reports:

After the heatmap is generated, we can analyze the heatmap and will come to a conclusion.

With the above heatmap, below are the set of conclusions made:

  1. There is no correlation with the other variables for the number of dependents and age.
  2. There is a moderate correlation observed for the average monthly balance in the time span of the last two quarters.
  3. There is a high correlation between the average monthly balance with the previous month balance and the current month balance in the last quarter.
    It is possible to generate a heatmap for the customers who have churned and you can also compare with the customers that do not have. You can apply the filter of churn = False or True so that the heatmap can be observed. Through the analysis, it helps in deriving useful insights from data analysis to the prediction of the behavior.
  4. Power BI Training

    Weekday / Weekend Batches

Conclusion:

Through this article, you have got a clear idea of the process of integration of Python with Power BI. I hope the above information helps you. To get a clear understanding and in-depth knowledge on the subject, you can get trained and certified in Power BI through the Power BI training. The integrated environment will definitely help the organizations to handle and play with the data as and when needed. It focuses on enhancing the power and capitalizing on the benefits that are available in both tools.

related articles 


Source link