Yale’s New Google-Friendly Smart Lock Makes a Great Security Starter. Here’s Why


Yale's Smart Lock with Matter showing lit keypad on testing model.

Yale Smart Lock with Matter

Pros

  • Simplified design is sturdy and makes installation easier
  • Matter compatibility with extra support for Google Home (an app I like)
  • In-depth settings with vacation mode, volume settings, autolocking and more
  • Affordable for a smart lock at under $150
  • Yale’s installation instructions are great and the design makes it easy, especially if you use Google Home

Cons

  • Inside battery cover is slightly flimsy
  • The door sensor add-on is a pain to install, although optional
  • No fingerprint access or similar extra features

Yale has a long-term partnership with Google Nest, yielding collaborations including the Yale x Nest smart lock. But that lock is several years old now, and Yale has a new model available in 2026: the Yale Smart Lock with Matter. (Matter is the smart home standard that platforms such as Google Home support.)

The new Yale Lock is available for around $150, making it one of the more affordable deadbolt replacement smart locks. By cutting out some of the old clutter and streamlining installation, Yale has created a lock that’s particularly well-suited to smart security newcomers. It also offers many of my favorite lock features, including customizable auto-locks, quick pass creation and a vacation mode.

But the latest Google-friendly Yale lock isn’t perfect. I’m not a huge fan of the add-on sensor, even if it’s included for free. But if you use Google Home and are looking for a simple smart keypad lock to dip into the world of smart security, it needs to be toward the top of your list.

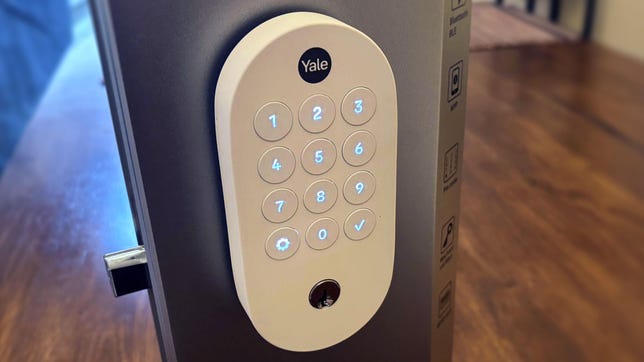
Yale’s design is simple and reliable

Yale's smart lock on metal testing platform on a wood table.

Yale’s simplified design is welcome, although the batter cover is a little flimsy compared to the rest of the model.

Tyler Lacoma/CNET

Yale has a long history in home security. The brand has come out with everything from safes to locks to delivery boxes, which helps make this lock design both familiar and reliable.

Yale’s latest model isn’t especially compact — like a Level Lock — but it’s solid and easy to understand, with a straightforward keypad (using autolit buttons and confirmation chimes) and a traditional keyhole on its front. The lock is rated at BHMA Grade 2, right in the middle of the lock security standard and suitable for basically all residential purposes.

Yale has skipped the bells and whistles, such as fingerprint ID, face recognition or NFC support for this lock, so the outer section is relatively plain compared to more complicated locks.

The inside unit of the lock is only a deadbolt knob and a cover that hides the battery compartment, which takes four AA batteries (included) to operate. The indoor cover is slightly flimsy compared to the rest of the construction, but that won’t impact security much, although it risks damage if something smashes into it.

Installation proved smooth for a smart lock

Yale's smart lock showing cable connected to battery unit.

Yale’s design makes this smart lock installation easy. 

Tyler Lacoma/CNET

Smart locks are one of the more complicated home devices to install, but don’t let that scare you away from Yale’s latest lock. This version is easier to install than most locks I’ve reviewed. The simple construction is backed by detailed written instructions as well as videos through Yale’s website, so you’ll get plenty of guidance.

I installed my version with only one Philips screwdriver, and you shouldn’t need much more for any standard home door. By skipping the extras some locks include, the Yale lock setup was quick, which is one reason I like this model as a first-time smart home device. It may not be as simple as a retrofit, but it’s streamlined compared to many alternatives.

Yale's smart lock showing battery panel with two batteries installed.

Yale’s lock requires four AA batteries.

Tyler Lacoma/CNET

But I’m not a big fan of its extra open/close sensor. This feature requires sticking an additional sensor nub to your doorframe so the lock can tell if the door has remained open. Unfortunately, these separate sensors don’t fit on all door trim, are easy to accidentally knock off and add an annoying installation step.

More and more locks can sense open/close status without these add-ons, too. However, this sensor is entirely optional and you can ignore it unless sensing open doors is especially important to you. If you want to get alerts should an older relative leave their door open, I can see where some people would appreciate this feature.

Google Home and Yale’s plentiful smart lock features

Google Home showing a Yale smart lock home screen.

Wtih Google Home, setting up Yale’s lock is stress-free.

Tyler Lacoma/CNET

Behind the simple design of Yale’s new Matter smart lock are app features that indicate its usefulness and power. Since Yale’s lock is Google-forward, I set it up with Google Home, which has major advantages for Google users.

Google Home will recognize the lock with a QR code scan and set it up swiftly — no need to input your Wi-Fi login unless you’ve never used Google Home before. While the lock supports other Matter platforms such as Apple Home, I found it will only set up on platform at a time, so I stuck with Google Home, where features are fullest and alerts already pop up on my phone. It also compared well to Yale’s own app, which I find lacking in intuitive design.

Google Home showing autolock options for a Yale smart lock.

Autolocking and other important features are included with Yale’s lock.

Tyler Lacoma/CNET

The lock/unlock screen is bland, although it does have a vacation mode you can activate to disable the keypad entirely when you’re away for long periods of time. Inside the settings, options expand. You can set the timer length of your auto-locking capability, enable one-touch unlocking and locking and adjust what kind of notifications you get, including battery alerts. Don’t like the chime sounds? You can lower the volume or turn them off. 

Google Home also allows you to give ongoing access to certain people, or create guest passcodes that can be used for a limited time. The current version of Google Home’s app is streamlined, speedy and very easy to understand — a highlight of using the lock. It also means I can switch to other smart devices on Google home or explore integrations with them and Yale’s lock. That extends to compatibility with certain Nest products.

Google Home app showing settings options for Yale's smart lock.

Yale’s lock has settings to adjust sound, one-touch controls, what notifications you want and plenty more.

Tyler Lacoma/CNET

“Hey Google,” I said to my Nest Hub Max, “unlock my Yale lock for me.” “Please say the code for the Yale Smart Lock,” Google Gemini replied (I could also type it into the Nest touchscreen). I like this added feature, since it helps prevent strangers from accessing my lock through the smart home, such as with AI promptware attacks. “What’s the status of my Yale lock?” also works if you aren’t sure if the door is locked. I came across zero connection difficulties or dropped signals during my testing.

Yale’s lock is made to match the Google Nest Doorbell in style, but having a doorbell doesn’t add any extra features to the lock, at least not yet. Yale has had specific Google Nest integrations in the past, such as being able to use Nest Familiar Face technology to automatically unlock on recognition with a previous version of the ADT Plus app. Similar features may come to this lock in time.

Final thoughts on the Yale Smart Lock with Matter

I really like the incremental improvements to smart locks shown by the Yale Smart Lock with Matter, including a somewhat easier installation process and straightforward app settings with a focus on the most high-value features. It’s also nice to be able to bypass Yale’s app entirely and rely on the Google Home app, since I already use that platform frequently.

While the inside cover is slightly flimsy, and I still don’t like those door sensor add-ons, this new lock remains impressive and a strong accompaniment to the Nest Doorbell, although I wish those two devices had some integrations to make the pairing more worthwhile — perhaps in the future.

For now, the latest Google and Yale lock is an excellent starter model for Google fans looking for a more minimal, affordable model. And remember, that Matter support means it can work with Apple Home and Alexa, too, although you may lose a tiny bit of functionality. 


Source link

Leave a Reply

Subscribe to Our Newsletter

Get our latest articles delivered straight to your inbox. No spam, we promise.

Recent Reviews


Alteryx Tools – Table of Content

What is Power BI?  

Power BI is referred to as a Software as a service (SaaS) platform, a Business Intelligence tool that helps analyze organizational data and also helps in creating real-time and interactive dashboards. The Power BI business intelligence tool can be installed on any desktop, mobile or can be used online as well. It also helps in collaborating with every peer in the organization. Power BI is a data visualization tool that helps in developing dashboards and BI reports with business intelligence capabilities. Apart from data visualization, it also allows to perform data exploration, helps in establishing reliable and secure connections to the cloud data sources.

Power BI is used by many organizations because of its amazing features like visualization creation. Some of the visualization formats are column charts, area plots, bar charts, line plots, scatter plots, pie charts, treemaps, scatter plots, etc. It also includes a navigation pane that helps in navigating to the dashboards and reports, associated applications, recent work, etc. The Power BI tool also includes inbuilt functions called DAX functions that can be used for data analysis. These are predefined functions that are available in the library. In Power BI, the data can be imported either from a single or multiple data sources. Power BI is also capable of providing extensive support to both structured and unstructured data. It also includes pre-built templates for dashboard creation. You can also create customized dashboards. 

What is Python?

Python is referred to as a high-level, general-purpose, interpreted programming language that includes a set of pre-built functions and libraries which helps in performing complex operations and calculations. It is easy to learn and is used in most fields like data analytics, artificial intelligence, machine learning, etc. 

Python includes two libraries called Matplotlib and Pandas. Matplotlib library consists of the predefined functions that help in plotting the data visualizations while the pandas library also includes the predefined functions that help in working with the data available.

Become a Power BI Certified professional by learning this HKR Power BI Training !

Power BI Training

  • Master Your Craft
  • Lifetime LMS & Faculty Access
  • 24/7 online expert support
  • Real-world & Project Based Learning

Prerequisites for Power BI Python Integration:

Below is the list of the prerequisites required for Power BI Python Integration to take place.

  1. Python runtime installation: The python runtime installation includes the installation of the execution run time through which the Python script operations can be performed.
  2. Libraries installation: It is essential that some of the important libraries have to be installed which increases the robustness of Power BI. Some of the important libraries are Seaborn and Pandas.
  3. Installation of Visual Studio Code: The installation of Visual Studio code is optional. You can also install any other code editor for writing your python scripts. You can also make use of the Power BI script editor to write the scripts.
  4. Power BI settings update: The final step is to update the settings so that you can work efficiently with Python in Power BI. Through this, you can perform the scripting in Power BI. All you need to do is open up the Power BI desktop, click on the file option. Then click on options followed by settings, then navigate to the opportunities which open a new dialogue box in Power BI. Then you can click on the Python scripting, select the path from the directories and IDE of Python. Once done, you will need to click on the OK button.

Understanding the need for Python Integration in Power BI:

By now, you all might have got an idea of what Power BI and Python is for. Yes, Python is referred to as the powerful tool that helps in creating visualizations while Power BI is for creating well-versed dashboards. These dashboards include all the information which helps in providing a complete view of the organization growth, metrics, KPIs, etc. Hence, if Python and Power BI are integrated, it will be a plus for us to utilize the capabilities that Power BI and Python hold.

Apart from the above, Python and Power BI integration includes several other benefits listed below.

  • The users are allowed to run the python scripts directly within the Power BI
  • Through the integration, libraries like Matplotlib and Seaborn can be used in Power BI for data visualization.
  • Python has become a leading technology and all the machine learning frameworks and data science libraries are written in Python. Through the integration, it allows to create of the data analysis scripts using Power BI
  • To perform precise calculations and clear the complexities, some of the enriched libraries like NumPy and Pandas can be used.

Click here to learn Power BI Tutorial

Power BI Python Integration:

In order to solve complex problems in an organization, it requires data and analytics. It also requires future predictions which gives us future insights and helps us clear the bypass of the issues. Through the business intelligence tools, all these predictions and data visualizations are represented in different forms for a better understanding and analysis. With the amazing capabilities that Power BI and Python hold, organizations are being successful with their integration attaining benefits.

Any idea on how the Power BI Python Integration is performed? Well, I will help with the step by step process to perform the Power BI Python integration.

  • Setup the Integrated Environment:

The primary step is to set up an integrated environment ready for the integration process to begin. You will need to have a distribution of Python readily installed in your machine/desktop. I preferred Anaconda for coding related tasks and the base distribution of Python. Sometimes, trying to integrate Anaconda with Power BI is a difficult task.

After the installation process is completed, you will need to install four python packages, each one has its own significance. They are :

Pandas – for data analysis and data manipulation

Matplotlib and seaborn – for plotting purposes

NumPy – for performing scientific calculations

The pip command in the command line tool is used for installing these packages into the machine.

pip install pandas

pip install matplotlib

pip install NumPy

pip install seaborn

Once the above packages are installed, the python scripting needs to be enabled in Power BI. If you want to check, you can open the Power BI and detect whether the python distribution is automatically detected or not. You will need to go to the files, followed by options and settings, then click on options. You will be able to view the home directory for Python under python scripting that is installed in the machine.

Setup the Integrated Environment

Acquire Vagrant certification by enrolling in the HKR Vagrant Training program in Hyderabad!

  • HKR Trainings Logo

    Subscribe to our YouTube channel to get new updates..!

  • Data Importing using the Python script:

It is time for you to check whether Python is working within Power BI by running a sample test. The primary step to perform this function is to import a small dataset using the Python script in Power BI.

To perform this, you will need to navigate to the Home ribbon, then move to the GetData option and click on the other option. Through this, you will be able to import the data from a different set of sources available. Some of the sources are Spark, Hadoop distributed file system, (HDFS), Web, etc. In the below image, I am going to import the Churn Prediction system that is available in my system.

Data Importing using the Python

Once you click on the connect option, you will see a section that allows you to write the Python script.

Python script

You will need to click on the OK button which will further ask you to select the churn data. Once done, you will need to click on the Load option. You can also perform a check whether the data has been loaded or not through the data view option. With this, you are now ready to make use of the power query in order to perform the data transformations.

Using Power Query To Transform the data:

All the individuals who have learned Python would know that data transformation is no longer a single task-based activity.

By using the Power Query editor, the user can shape and transform the data as required with just a single click. The Power BI is also capable of keeping the record of all the transformations and operations that take place or happen during the process of transformation. We will now show you how to use the Power query to understand and know the data transformation capabilities.

Once the data is loaded in the Power BI, you will need to click on the transform data option which is available under the Home tab in order to open the query editor.

Once the query editor is opened up, you will see multiple options to perform the operations like clean, reshape and transform the data.

Power Query To Transform

We will now convert the customer_nw_category variable into a text field because these fields represent the worth category. Also, you need to know that it would not be a continuous variable.

To perform the same, you will need to select the column -> Go to the Data Type, and change the data type to a text format. All the steps will be recorded by the Power query under the applied steps section. You can also rename these steps for a better recall or reference. I will rename this step as nw_cat Text. The next step is to transform the churn column into a logical variable. True here represents for churned (1), whereas False here represents not churned (2). The step can be renamed as Churn True/False.

customer_nw_category

Once the above operation is performed, you will need to click on the close and apply option which will be available on the top left corner so that all the transformations made will be applied.

Using Python’s Statistical within Power BI:

Power BI is considered a library of visualization. Correlation matrix heatmap is an integral component in the data analysis reports.

We will guide you on how to create a correlation matrix heatmap by making use of the Python correlation function. The created heatmap will be available in the reports section in Power BI.

You will need to navigate to the Report section that is available in the Power BI. Then click on the Py symbol which denotes Python visual which is available under the visualizations section. On the left side, you will see an empty Py along with a Python script editor popping up at the bottom of the screen. By this, you might have understood that Power BI is providing an option to create the visualizations with the scripts.

All the value fields will be empty firstly. For correlation heatmap illustration, all the continuous variables will be brought into the value fields, like the age current, previous month balance, monthly balance items, etc. This is considered one of the most essential steps during the integration process. If you forget to perform this step, the Power BI will not be able to recognize the variables.

As the variables are moved into the values fields, the python script will be automatically populated with the below codes.

Let us also write the code for correlation heatmap creation in Python by using the seaborn package.

# import the charting libraries matplotlib and seaborn

import matplotlib.pyplot as plt

import seaborn as sns

# create the correlation matrix on the dataset

corr = dataset.corr()

# create a heatmap of the correlation matrix

sns.heatmap(corr, cmap="YlGnBu")

# show plot

plt.show()

You can now use the run script button and run the script, which will produce a correlation matrix heatmap.

Python’s Statistical within Power BI

Generating analytical reports:

After the heatmap is generated, we can analyze the heatmap and will come to a conclusion.

With the above heatmap, below are the set of conclusions made:

  1. There is no correlation with the other variables for the number of dependents and age.
  2. There is a moderate correlation observed for the average monthly balance in the time span of the last two quarters.
  3. There is a high correlation between the average monthly balance with the previous month balance and the current month balance in the last quarter.
    It is possible to generate a heatmap for the customers who have churned and you can also compare with the customers that do not have. You can apply the filter of churn = False or True so that the heatmap can be observed. Through the analysis, it helps in deriving useful insights from data analysis to the prediction of the behavior.
  4. Power BI Training

    Weekday / Weekend Batches

Conclusion:

Through this article, you have got a clear idea of the process of integration of Python with Power BI. I hope the above information helps you. To get a clear understanding and in-depth knowledge on the subject, you can get trained and certified in Power BI through the Power BI training. The integrated environment will definitely help the organizations to handle and play with the data as and when needed. It focuses on enhancing the power and capitalizing on the benefits that are available in both tools.

related articles 


Source link