10 best ways to redeem 100K Alaska Airlines Atmos Rewards points


Alaska Airlines’ new Atmos Rewards loyalty program has preserved what made the former Mileage Plan program so beloved: a published partner award chart with fairly reasonable redemption rates, distance-based sweet spots and free one-way stopovers.

Pair that with a new premium credit card with a huge welcome offer, and there’s never been a better time to learn just how valuable Atmos Rewards points can be.

The Atmos™ Rewards Summit Visa Infinite® credit card is offering 100,000 bonus points and a 25,000-point Global Companion Award after spending $6,500 on purchases in the first 90 days from account opening. Additionally, new cardholders will receive a 50% flight discount code for a qualifying future flight after opening their account.

That many points open up endless travel possibilities. Whether you book a lie-flat round-trip flight across the Atlantic or short domestic flights, here are 10 ways you can redeem up to 100,000 Atmos Rewards points.

Related: Why this is the most rewarding airline card for international travelers

The best ways to redeem 100,000 Atmos Rewards points

Cathay Pacific Aria Suite
ERIC ROSEN/THE POINTS GUY

With Alaska Airlines being a member of the Oneworld alliance — while also maintaining some unique airline partnerships — you’ll likely get the best value from your Atmos Rewards points by redeeming them for flights on partner airlines.

Aer Lingus lie-flat business-class seats to Ireland

One of the best-value ways to use Atmos Rewards points is to book Aer Lingus business-class seats from the East Coast to Ireland. Fly from New York’s John F. Kennedy International Airport (JFK); Boston Logan International Airport (BOS); Dulles International Airport (IAD) near Washington, D.C.; and Cleveland Hopkins International Airport (CLE), among other U.S. airports, to Dublin Airport (DUB) starting at 45,000 points (not including taxes and fees).

If you find availability, you can potentially secure a round-trip flight in a lie-flat seat for just 90,000 points. That still leaves 10,000 Atmos Rewards points in your balance, which could use to cover a short hop elsewhere or a positioning flight.

Related: What it’s like flying Aer Lingus’ Airbus A321XLR to Ireland

Reward your inbox with the TPG Daily newsletter

Join over 700,000 readers for breaking news, in-depth guides and exclusive deals from TPG’s experts

American Airlines premium cabin seats to London

If London is calling, you can fly American Airlines’ new Flagship Suite operating on select Boeing 787-9 flights from Philadelphia International Airport (PHL) or Chicago’s O’Hare International Airport (ORD) to London’s Heathrow Airport (LHR) starting at 55,000 Atmos Rewards points each way (plus taxes and fees).

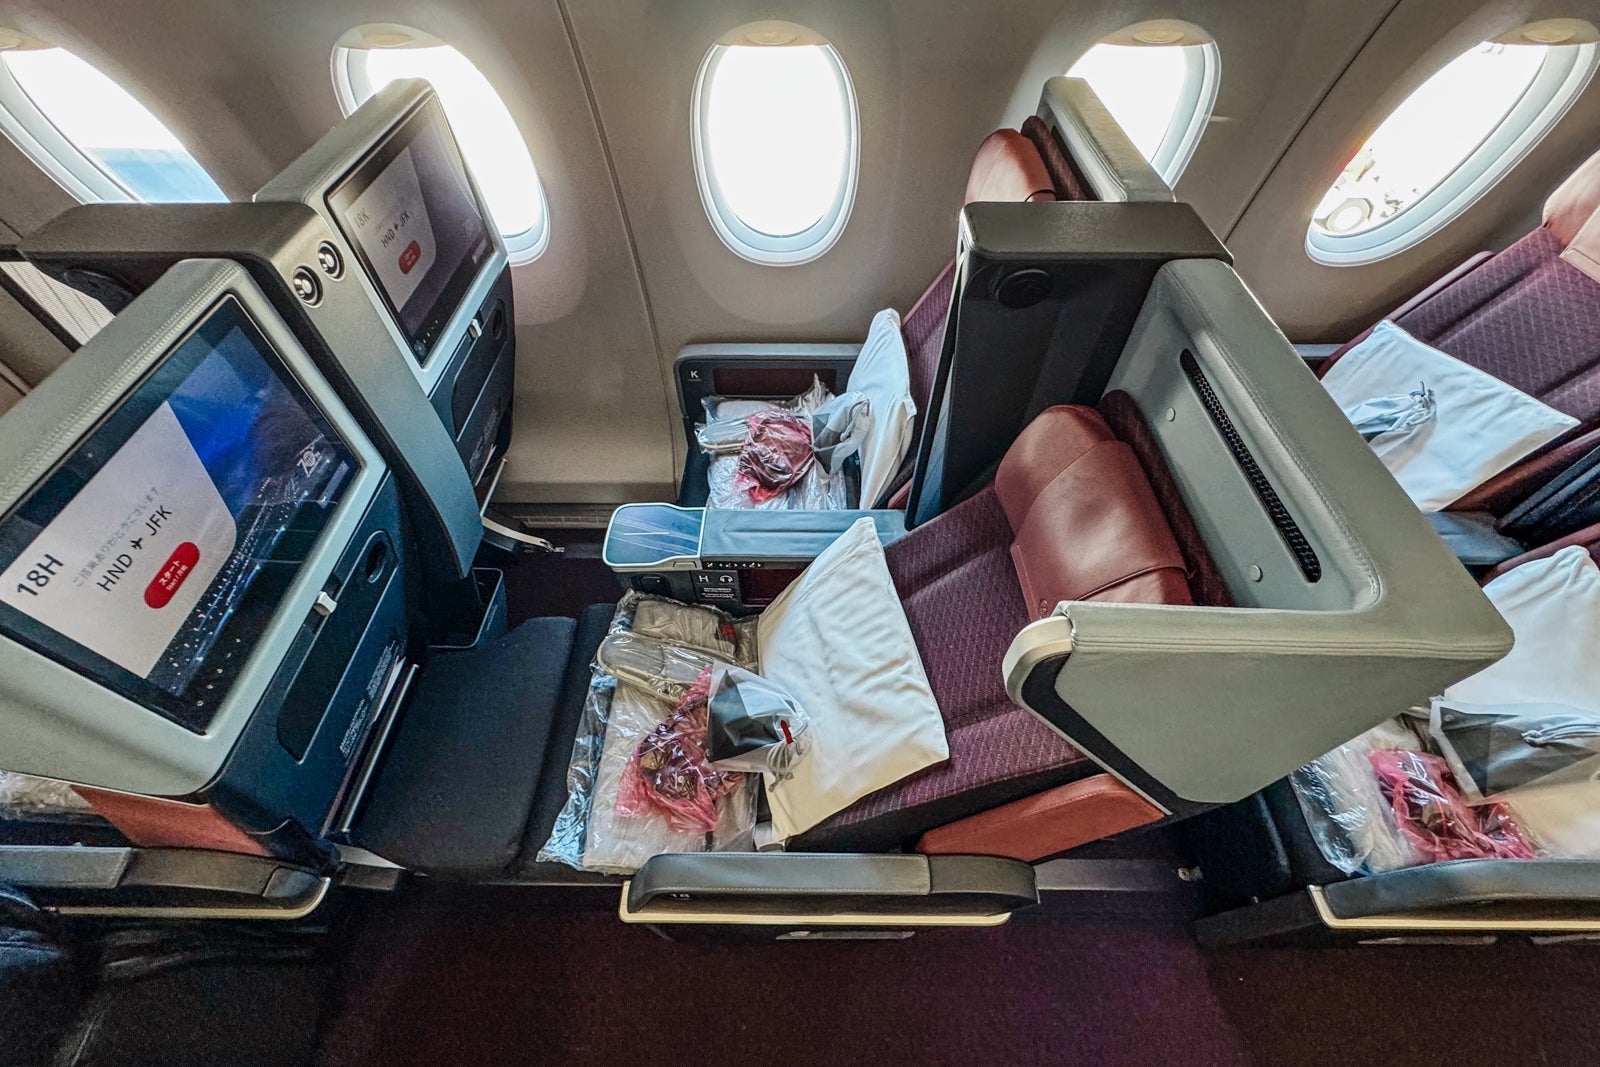
Japan Airlines premium cabin seats to Tokyo

Atmos Rewards members can unlock seats in Japan Airlines’ business class from Seattle-Tacoma International Airport (SEA) to Tokyo’s Narita International Airport (NRT) starting at 60,000 points each way. While a true round-trip ticket comes to 120,000 points, you could book the outbound in business class and the return in premium economy for 100,000 Atmos Rewards points. With that combination, you’d still get the best of both worlds: lie-flat comfort one-way and a solid premium economy product on the way home.

Alternatively, if you’re traveling from the East Coast, consider a round-trip, nonstop flight in Japan Airlines’ swanky Airbus A350-1000 aircraft from JFK to NRT starting at 100,000 Atmos Rewards points for premium economy.

Related: First look at Japan Airlines’ new premium economy on the Airbus A350-1000

JAL A350 premium economy
ERIC ROSEN/THE POINTS GUY

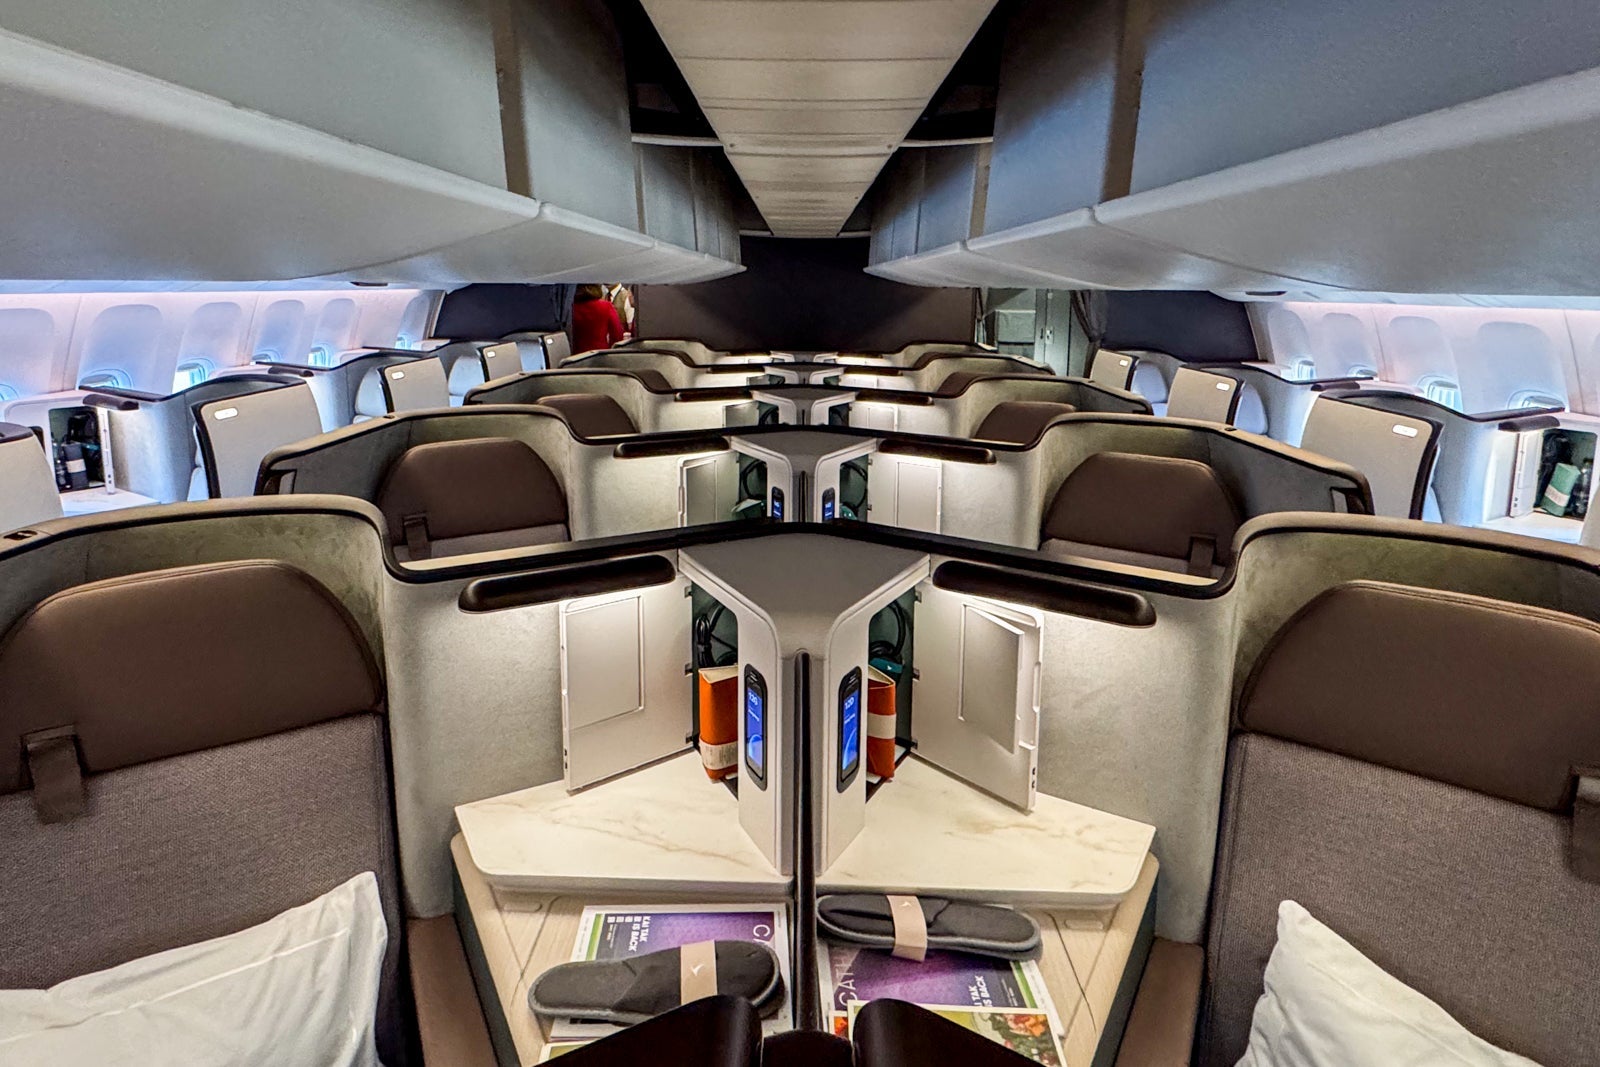
Cathay Pacific’s new Aria Suite to Hong Kong

Book Cathay Pacific’s new Aria Suite business class, currently operating from Vancouver International Airport (YVR) in British Columbia to Hong Kong International Airport (HKG), starting at 75,000 Atmos Rewards points one-way. This refreshed cabin offers more privacy, sculpted shells and modern touches like customizable lighting and expanded storage.

The wide seats convert into fully flat beds, and they come with upgraded bedding. Meals are also artfully plated.

With its suitelike feel and high-end finishes, Aria raises the bar for long-haul business class on this already impressive Asian carrier.

Fiji Airways premium cabin seats to Fiji and Australia

With Atmos Rewards’ generous stopover rules, you can turn a trip on Fiji Airways into a two-in-one adventure. Fly from Los Angeles International Airport (LAX) to Fiji’s Nadi International Airport (NAN) in business class, enjoy tropical Fiji for a few days and then continue to Australia on the same ticket from 85,000 points.

Once you’re Down Under, you could use your remaining 15,000 Atmos Rewards points to fly Oneworld partner airline Qantas, which offers astonishingly affordable short-haul Atmos Rewards redemptions. If you wanted to add on a trip to New Zealand, you could fly round-trip in economy from Sydney Airport (SYD) to New Zealand’s Auckland Airport (AKL) from just 15,000 Atmos Rewards points.

Related: 5 things I loved about flying Fiji Airways business class

Fiji, Mamanuca islands, Treasure island
Mamanuca Islands, Fiji. WESTEND61/GETTY IMAGES

Qantas premium economy seats to Australia

Australia is notoriously tough when it comes to finding business-class award availability, so consider booking premium economy. Qantas’ premium economy strikes a nice balance between extra legroom, wider seats, better catering and priority airport services.

With Atmos Rewards points, you can book a round-trip from the U.S. to Australia’s Melbourne Airport (MEL), Brisbane Airport (BNE) or SYD starting at 110,000 Atmos Rewards points for premium economy.

While not as glamorous as Qantas’ lie-flat business-class seats, premium economy still makes the more than 14-hour trek much more pleasant.

Alaska Airlines or Hawaiian Airlines economy seats to Hawaii

If you’d prefer to keep things closer to home, Atmos Rewards points unlock terrific value when booking flights to Hawaii. Flights from West Coast airports to Honolulu’s Daniel K. Inouye International Airport (HNL) in economy start at only 15,000 points each way when flying either Alaska Airlines or Hawaiian Airlines.

You could take a whole family of five round-trip to Hawaii with one credit card’s welcome bonus.

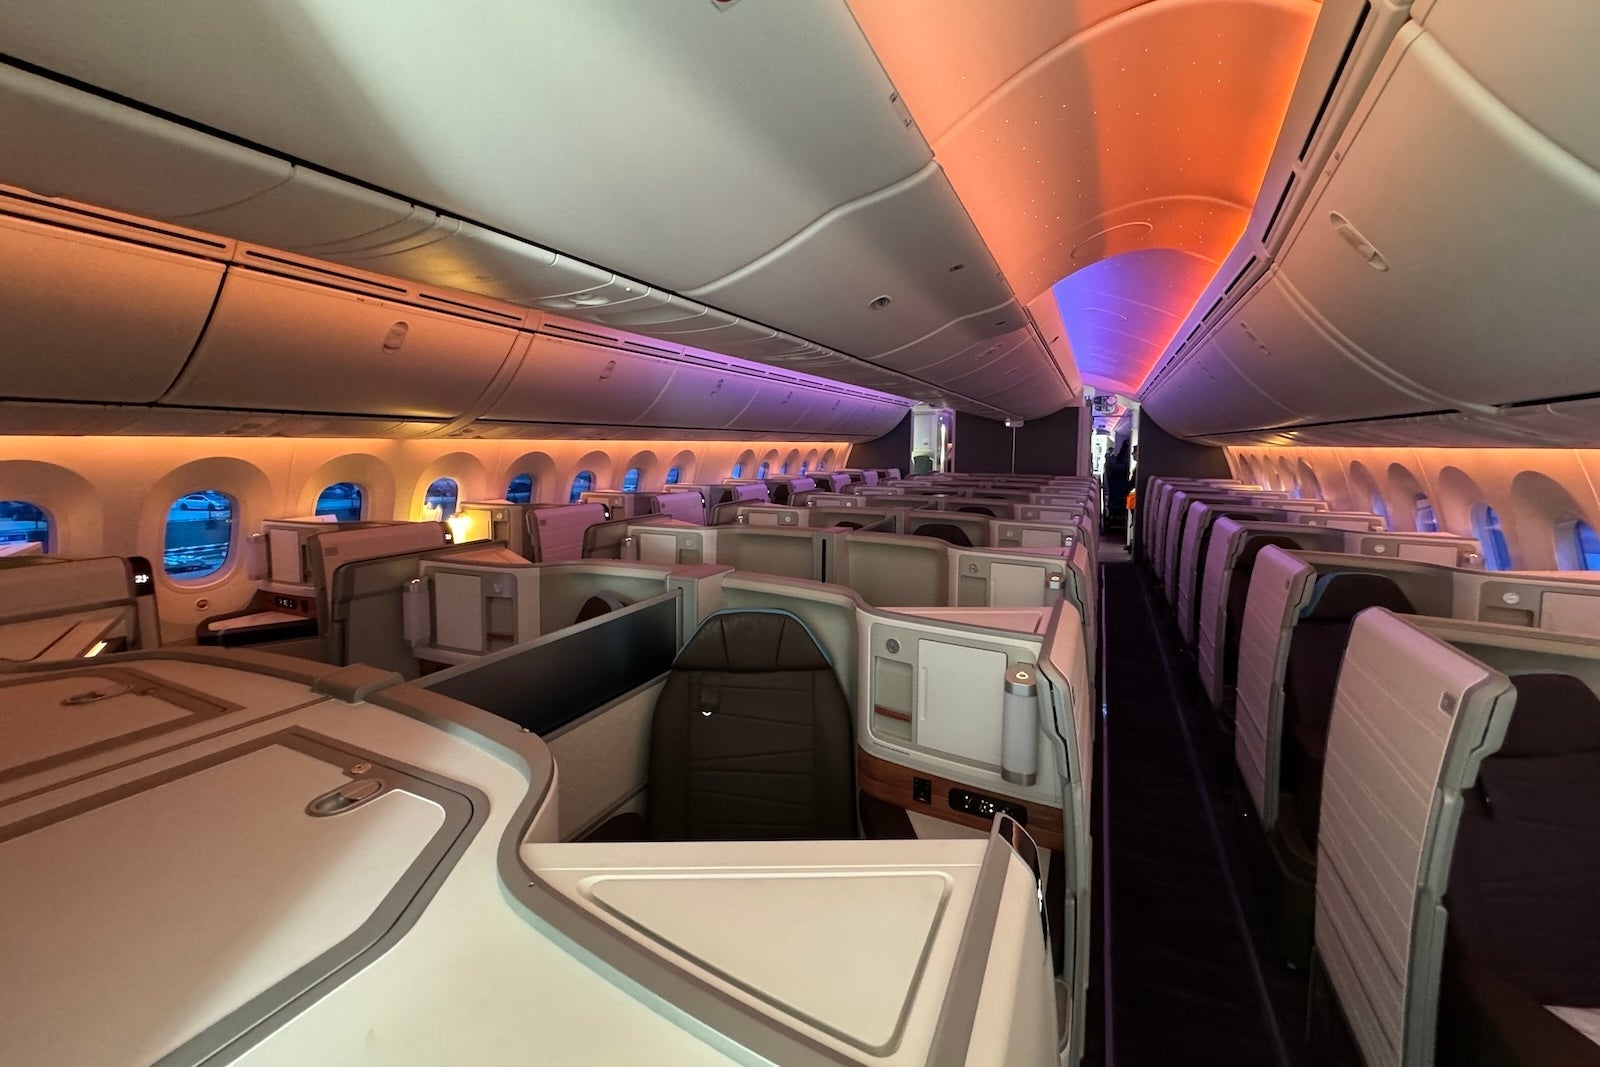
Hawaiian Airlines’ new Boeing 787 business class to Hawaii

If you want to try out a new premium cabin without leaving the country, Hawaiian Airlines now flies its fancy, new Boeing 787 Dreamliner on select routes between West Coast airports, including LAX and San Francisco International Airport (SFO), and HNL. These aircraft feature the airline’s innovative Leihoku Suites, offering direct-aisle access, lie-flat seats and sliding privacy doors, all with the Aloha warmth of Hawaiian service — an upgrade compared to Hawaiian’s older wide-body cabins.

Using Atmos Rewards points, award rates start at 40,000 points each way in business class when departing from LAX or SFO. Thus, a round-trip flight starts at 80,000 Atmos Rewards points.

Related: We got a sneak peek at Hawaiian Airlines’ stunning new Boeing 787-9 Dreamliner

Hawaiian Airlines Boeing 787 Dreamliner.
ERIC ROSEN/THE POINTS GUY

American Airlines economy seats across the US

Another underrated use of Atmos Rewards points is for booking domestic flights under 700 miles on American Airlines. As a partner airline, these flights can cost just 4,500 Atmos Rewards points each way, meaning you can get an incredible 22 one-way trips or 11 round-trips out of your 100,000-point balance. If you often need positioning flights to reach partner gateways or just want quick weekend getaways, this option delivers constant value.

American Airlines, Aer Lingus and Iberia economy seats to Europe

Finally, you can cross the Atlantic in economy starting from only 22,500 points each way on partner airlines like Aer Lingus, American Airlines and Iberia. That works out to two round-trips for 90,000 Atmos Rewards points, with 10,000 points left over. It’s not glamorous, but it’s a reliable way to stretch the Atmos Rewards Summit‘s 100,000-point welcome bonus across multiple international vacations.

This award rate is also available to book through British Airways Club, but the airline imposes hefty surcharges, so look for other partner options to Europe instead.

Related: Alaska Trifecta: Why I signed up for the new premium Atmos Rewards Summit credit card

Bottom line

With 100,000 Atmos Rewards points, you can book a lie-flat business-class seat to Ireland and back; a part-premium economy, part-business-class ticket to Asia; or even several round-trip flights to Hawaii. The partner award chart, distance-based sweet spots and free stopovers make Atmos Rewards one of the most powerful airline currencies.

The Atmos Rewards Summit currently offers an incredible 100,000 bonus points and a 25,000-point Global Companion Award after spending $6,500 on purchases in the first 90 days from account opening. New cardholders will also receive a 50% flight discount code for a qualifying future flight after opening their account. That’s enough to unlock great value to plan your next big trip.

Related reading:


Source link

Leave a Reply

Subscribe to Our Newsletter

Get our latest articles delivered straight to your inbox. No spam, we promise.

Recent Reviews


Alteryx Tools – Table of Content

What is Power BI?  

Power BI is referred to as a Software as a service (SaaS) platform, a Business Intelligence tool that helps analyze organizational data and also helps in creating real-time and interactive dashboards. The Power BI business intelligence tool can be installed on any desktop, mobile or can be used online as well. It also helps in collaborating with every peer in the organization. Power BI is a data visualization tool that helps in developing dashboards and BI reports with business intelligence capabilities. Apart from data visualization, it also allows to perform data exploration, helps in establishing reliable and secure connections to the cloud data sources.

Power BI is used by many organizations because of its amazing features like visualization creation. Some of the visualization formats are column charts, area plots, bar charts, line plots, scatter plots, pie charts, treemaps, scatter plots, etc. It also includes a navigation pane that helps in navigating to the dashboards and reports, associated applications, recent work, etc. The Power BI tool also includes inbuilt functions called DAX functions that can be used for data analysis. These are predefined functions that are available in the library. In Power BI, the data can be imported either from a single or multiple data sources. Power BI is also capable of providing extensive support to both structured and unstructured data. It also includes pre-built templates for dashboard creation. You can also create customized dashboards. 

What is Python?

Python is referred to as a high-level, general-purpose, interpreted programming language that includes a set of pre-built functions and libraries which helps in performing complex operations and calculations. It is easy to learn and is used in most fields like data analytics, artificial intelligence, machine learning, etc. 

Python includes two libraries called Matplotlib and Pandas. Matplotlib library consists of the predefined functions that help in plotting the data visualizations while the pandas library also includes the predefined functions that help in working with the data available.

Become a Power BI Certified professional by learning this HKR Power BI Training !

Power BI Training

  • Master Your Craft
  • Lifetime LMS & Faculty Access
  • 24/7 online expert support
  • Real-world & Project Based Learning

Prerequisites for Power BI Python Integration:

Below is the list of the prerequisites required for Power BI Python Integration to take place.

  1. Python runtime installation: The python runtime installation includes the installation of the execution run time through which the Python script operations can be performed.
  2. Libraries installation: It is essential that some of the important libraries have to be installed which increases the robustness of Power BI. Some of the important libraries are Seaborn and Pandas.
  3. Installation of Visual Studio Code: The installation of Visual Studio code is optional. You can also install any other code editor for writing your python scripts. You can also make use of the Power BI script editor to write the scripts.
  4. Power BI settings update: The final step is to update the settings so that you can work efficiently with Python in Power BI. Through this, you can perform the scripting in Power BI. All you need to do is open up the Power BI desktop, click on the file option. Then click on options followed by settings, then navigate to the opportunities which open a new dialogue box in Power BI. Then you can click on the Python scripting, select the path from the directories and IDE of Python. Once done, you will need to click on the OK button.

Understanding the need for Python Integration in Power BI:

By now, you all might have got an idea of what Power BI and Python is for. Yes, Python is referred to as the powerful tool that helps in creating visualizations while Power BI is for creating well-versed dashboards. These dashboards include all the information which helps in providing a complete view of the organization growth, metrics, KPIs, etc. Hence, if Python and Power BI are integrated, it will be a plus for us to utilize the capabilities that Power BI and Python hold.

Apart from the above, Python and Power BI integration includes several other benefits listed below.

  • The users are allowed to run the python scripts directly within the Power BI
  • Through the integration, libraries like Matplotlib and Seaborn can be used in Power BI for data visualization.
  • Python has become a leading technology and all the machine learning frameworks and data science libraries are written in Python. Through the integration, it allows to create of the data analysis scripts using Power BI
  • To perform precise calculations and clear the complexities, some of the enriched libraries like NumPy and Pandas can be used.

Click here to learn Power BI Tutorial

Power BI Python Integration:

In order to solve complex problems in an organization, it requires data and analytics. It also requires future predictions which gives us future insights and helps us clear the bypass of the issues. Through the business intelligence tools, all these predictions and data visualizations are represented in different forms for a better understanding and analysis. With the amazing capabilities that Power BI and Python hold, organizations are being successful with their integration attaining benefits.

Any idea on how the Power BI Python Integration is performed? Well, I will help with the step by step process to perform the Power BI Python integration.

  • Setup the Integrated Environment:

The primary step is to set up an integrated environment ready for the integration process to begin. You will need to have a distribution of Python readily installed in your machine/desktop. I preferred Anaconda for coding related tasks and the base distribution of Python. Sometimes, trying to integrate Anaconda with Power BI is a difficult task.

After the installation process is completed, you will need to install four python packages, each one has its own significance. They are :

Pandas – for data analysis and data manipulation

Matplotlib and seaborn – for plotting purposes

NumPy – for performing scientific calculations

The pip command in the command line tool is used for installing these packages into the machine.

pip install pandas

pip install matplotlib

pip install NumPy

pip install seaborn

Once the above packages are installed, the python scripting needs to be enabled in Power BI. If you want to check, you can open the Power BI and detect whether the python distribution is automatically detected or not. You will need to go to the files, followed by options and settings, then click on options. You will be able to view the home directory for Python under python scripting that is installed in the machine.

Setup the Integrated Environment

Acquire Vagrant certification by enrolling in the HKR Vagrant Training program in Hyderabad!

  • HKR Trainings Logo

    Subscribe to our YouTube channel to get new updates..!

  • Data Importing using the Python script:

It is time for you to check whether Python is working within Power BI by running a sample test. The primary step to perform this function is to import a small dataset using the Python script in Power BI.

To perform this, you will need to navigate to the Home ribbon, then move to the GetData option and click on the other option. Through this, you will be able to import the data from a different set of sources available. Some of the sources are Spark, Hadoop distributed file system, (HDFS), Web, etc. In the below image, I am going to import the Churn Prediction system that is available in my system.

Data Importing using the Python

Once you click on the connect option, you will see a section that allows you to write the Python script.

Python script

You will need to click on the OK button which will further ask you to select the churn data. Once done, you will need to click on the Load option. You can also perform a check whether the data has been loaded or not through the data view option. With this, you are now ready to make use of the power query in order to perform the data transformations.

Using Power Query To Transform the data:

All the individuals who have learned Python would know that data transformation is no longer a single task-based activity.

By using the Power Query editor, the user can shape and transform the data as required with just a single click. The Power BI is also capable of keeping the record of all the transformations and operations that take place or happen during the process of transformation. We will now show you how to use the Power query to understand and know the data transformation capabilities.

Once the data is loaded in the Power BI, you will need to click on the transform data option which is available under the Home tab in order to open the query editor.

Once the query editor is opened up, you will see multiple options to perform the operations like clean, reshape and transform the data.

Power Query To Transform

We will now convert the customer_nw_category variable into a text field because these fields represent the worth category. Also, you need to know that it would not be a continuous variable.

To perform the same, you will need to select the column -> Go to the Data Type, and change the data type to a text format. All the steps will be recorded by the Power query under the applied steps section. You can also rename these steps for a better recall or reference. I will rename this step as nw_cat Text. The next step is to transform the churn column into a logical variable. True here represents for churned (1), whereas False here represents not churned (2). The step can be renamed as Churn True/False.

customer_nw_category

Once the above operation is performed, you will need to click on the close and apply option which will be available on the top left corner so that all the transformations made will be applied.

Using Python’s Statistical within Power BI:

Power BI is considered a library of visualization. Correlation matrix heatmap is an integral component in the data analysis reports.

We will guide you on how to create a correlation matrix heatmap by making use of the Python correlation function. The created heatmap will be available in the reports section in Power BI.

You will need to navigate to the Report section that is available in the Power BI. Then click on the Py symbol which denotes Python visual which is available under the visualizations section. On the left side, you will see an empty Py along with a Python script editor popping up at the bottom of the screen. By this, you might have understood that Power BI is providing an option to create the visualizations with the scripts.

All the value fields will be empty firstly. For correlation heatmap illustration, all the continuous variables will be brought into the value fields, like the age current, previous month balance, monthly balance items, etc. This is considered one of the most essential steps during the integration process. If you forget to perform this step, the Power BI will not be able to recognize the variables.

As the variables are moved into the values fields, the python script will be automatically populated with the below codes.

Let us also write the code for correlation heatmap creation in Python by using the seaborn package.

# import the charting libraries matplotlib and seaborn

import matplotlib.pyplot as plt

import seaborn as sns

# create the correlation matrix on the dataset

corr = dataset.corr()

# create a heatmap of the correlation matrix

sns.heatmap(corr, cmap="YlGnBu")

# show plot

plt.show()

You can now use the run script button and run the script, which will produce a correlation matrix heatmap.

Python’s Statistical within Power BI

Generating analytical reports:

After the heatmap is generated, we can analyze the heatmap and will come to a conclusion.

With the above heatmap, below are the set of conclusions made:

  1. There is no correlation with the other variables for the number of dependents and age.
  2. There is a moderate correlation observed for the average monthly balance in the time span of the last two quarters.
  3. There is a high correlation between the average monthly balance with the previous month balance and the current month balance in the last quarter.
    It is possible to generate a heatmap for the customers who have churned and you can also compare with the customers that do not have. You can apply the filter of churn = False or True so that the heatmap can be observed. Through the analysis, it helps in deriving useful insights from data analysis to the prediction of the behavior.
  4. Power BI Training

    Weekday / Weekend Batches

Conclusion:

Through this article, you have got a clear idea of the process of integration of Python with Power BI. I hope the above information helps you. To get a clear understanding and in-depth knowledge on the subject, you can get trained and certified in Power BI through the Power BI training. The integrated environment will definitely help the organizations to handle and play with the data as and when needed. It focuses on enhancing the power and capitalizing on the benefits that are available in both tools.

related articles 


Source link