Minnesota moose numbers stabilize, growth effort begins


There’s a new effort afoot in northern Minnesota to better understand why the state’s moose population has remained stubbornly flat since it declined sharply about 15 years ago.

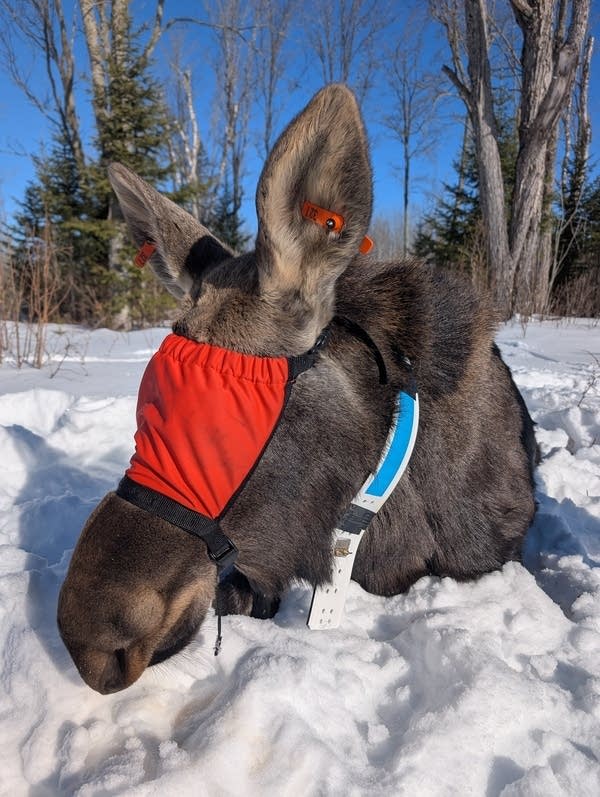
The Northern Moose Alliance also wants to better engage the public about scientists’ efforts to recover the iconic animal’s numbers in the northwoods. This winter, they placed GPS collars on 60 young moose, around nine months of age, that will allow them to track the animals as they grow to full adulthood.

Those “in-between” years, before juvenile moose become full-grown adults, represent a gap in research in the state. And those years are critical. They often determine whether a young moose survives long enough to join the breeding population and, ultimately, help moose numbers start to grow again.

“This project is aimed at really looking at what's happening with those younger moose,” said Michelle Carstensen, wildlife health program supervisor at the Minnesota Department of Natural Resources. “Are there challenges to getting them to one year old? When do they really reproduce? And how many calves are they contributing to the population?”

young moose in snow
A young moose that researchers placed a GPS collar on in northeast Minn. in Feb. The Northern Moose Alliance hopes to identify ways to help Minnesota's moose population recover.
Photo courtesy of Morgan Swingen

By teasing out answers to those questions, scientists from state, tribal, academic and nonprofit partners hope to gain clues that might allow wildlife and land managers to create better moose habitat in specific locations that could improve the odds of young moose surviving and becoming productive adults.

Collaring Moose

The project’s first phase began this winter, when researchers placed the tracking collars on young moose across the state’s core moose range, stretching roughly from Two Harbors to Ely to Grand Portage at the tip of the Arrowhead region.

Those collars will allow researchers to closely monitor their movements. They’re also equipped with mortality sensors that send notifications via satellite when a moose stops moving for six hours. Researchers will then investigate to determine the cause of death.

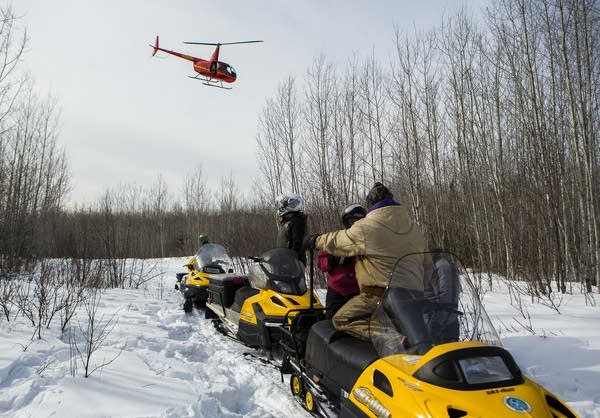
The group partnered with a helicopter capture company to perform the work. When crews spotted a young moose from the air using thermal imaging, they hovered above and shot it with a tranquilizing dart to sedate it.

They landed, attached the collar and quickly collected biological samples and assessed their overall health–including how many parasites, especially winter ticks, they were infested with.

moose with collar
One of 60 young moose, around nine months of age, that researchers placed GPS research collars on in Feb. in northeast Minnesota. The Northern Moose Alliance aims to better understand the challenges young moose face reaching adulthood.
Photo courtesy of Morgan Swingen

The work was conducted during intense periods of extreme cold, high winds and poor visibility.

“We’re flying in a helicopter with no doors,” said Seth Moore, the director of natural resources for the Grand Portage Band of Lake Superior Chippewa, one of the partners in the project. “So you have a wind chill that is absolutely brutally cold.”

But the work was successful. No moose died during the collaring effort– which is something that plagued the Minnesota Department of Natural Resources when it placed research collars on adult moose and calves over a dozen years ago, part of a landmark study that attempted to pinpoint the reasons behind the moose population’s crash in northeast Minnesota from nearly 9,000 animals 20 years ago to about 4,000 today.

“We're monitoring them daily for their survival,” Carstensen said. “I'm going to knock on wood, but so far, we haven't had a mortality.”

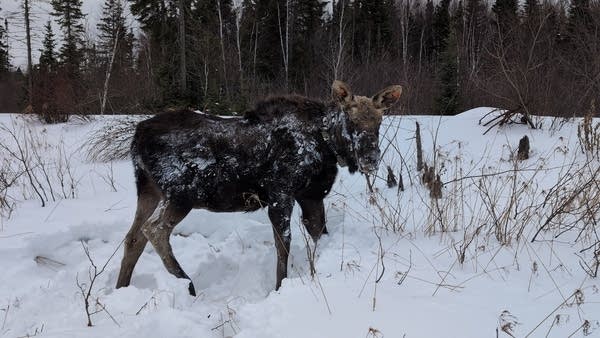
Researchers said the young moose they collared appeared healthier than anticipated. But they’re entering the most challenging time of the year.

A helicopter leaves the site of a moose collaring.
A helicopter flies away from the site where researchers with the Grand Portage Band of Lake Superior Chippewa and the 1854 Treaty Authority placed a research collar on a moose in 2016 on Grand Portage reservation.
Derek Montgomery for MPR News

They’ve made it through the majority of winter, but they’re still waiting for green-up to bring better forage with more nutritional value. Winter ticks are taking their last big blood meal.

It’s also the time of year when wolves can be most dangerous to moose. When a crust layer develops on top of deep snow during freeze-thaw cycles, moose will “post-hole right through” because they’re so heavy, Carstensen said. But wolves can run on top.

“As the winter fades and spring appears, wolves get that advantage, and it tends to be at a time when moose can be weaker,” said Carstensen. That’s why April tends to be a prime month for moose to die from predation.

“And they're usually taking advantage of young moose that are coming out of winter in the poorest condition, old moose or moose that have other pre-existing health conditions, like brain worm or really heavy tick loads,” Carstensen added.

More moose?

Earlier research has confirmed the many factors that contributed to northeast Minnesota’s plummeting moose population.

Winter ticks cause severe blood loss and energy depletion. Parasites, including liver flukes and brainworm–which is transmitted by white-tailed deer– further diminish moose health. Wolves and bears – which target moose calves – also threaten moose, especially when they’re already weakened by disease or parasites.

There’s no smoking gun. But scientists widely agree that climate change is the overarching culprit for moose decline in Minnesota, the southernmost part of their range. Mild winters have allowed ticks and deer to expand their range northward. Moose also suffer from heat stress in the summer.

Despite those challenges, moose numbers have stabilized at around 4,000 over the past decade.

“Stability is good. Reversing a decline and getting to stable is a great first step,” said Morgan Swingen, wildlife biologist for the 1854 Treaty Authority, an intertribal natural resources agency based in Duluth that’s co-leading the project along with the DNR. “But we would like to see the population increase again, and in order to do that, we need to have reproduction and survival happening.”

Collared moose
A successfully collared cow moose turns back toward the capture crew before ambling off into the thicket to be reunited with her calf.
Photo courtesy of the Minnesota DNR

The hope is that by learning the challenges young moose face, wildlife and land managers can develop more specific strategies that give moose the best chance at recovering.

If they find that moose are struggling to reproduce, for example, that could mean better habitat or forage is needed in specific locations. If researchers find young females are having plenty of calves, but those calves are having trouble surviving, that could suggest action may be needed to manage deer populations to control parasites, or bear or wolf numbers because of predation concerns.

Researchers plan to place more collars on young moose the next two winters and track the animals for six years. The work is supported by a $1.8 million grant from state lottery proceeds through the Minnesota Environment and Natural Resources Trust Fund.

Northern Moose Alliance scientists are also asking people to share trail camera photos of moose to help track hair loss caused by winter ticks. Researchers plan to share updates and videos highlighting their field work.

“People care deeply about moose,” said Tom Irivine, executive director of the National Parks of Lake Superior Foundation, another project partner. “We want the public to be able to follow along and become part of the solution to protecting this cherished and iconic species.”


Source link

Leave a Reply

Subscribe to Our Newsletter

Get our latest articles delivered straight to your inbox. No spam, we promise.

Recent Reviews


What is Power BI?

Power BI is a cloud-based business analysis and intelligence agency developed by Microsoft. It is a compilation of business intelligence and data analytical techniques, such as software services, applications and data connectors. We can use data sources extracted into Power BI to visualize and analyze data using shared reports, dashboards, and apps.Power BI is a user-friendly tool that offers remarkable drag-and-drop features and self-service abilities.

Become a Power BI Certified professional by learning this HKR Power BI Online Training !

Microsoft is offering three types of Power BI platforms:

  • Desktop Power BI(A desktop application)
  • Power BIService (SaaS i.e., Software as a Service)
  • Mobile Power BI (For iOS and Android devices)

We can also deploy Power BI on both on-site and cloud platforms. 

Why Power BI?

Power BI is an integrated system with several various types of data under its supervision.There seems to be a cloud-based BI service called Power BI Services that is used to display and communicate dashboards.A desktop-based report functionality known as the Power BI Desktop.Another useful service is Power BI Embedded, which keeps running on the Azure cloud platform and can be used for reporting, ETL and data analysis.

Now we discuss why it is an important tool in the present market.

  • One can easily do real time analysis in power bi by creating direct connections with the data sets.
  • Can take the advantage of the custom visualizations.
  • Can get the quick insights of the data.
  • Power BI marketplace as on-site communications make data transfer secure and technology scalable and reliable.
  • You can attach to other services via Power BI, such as SQL Server Analysis Services (SSAS), Microsoft Excel, etc.
  • Power BI is a new age application that helps state-of-the-art technologies such as HTML 5.0, column store databases, cloud computing, mobile apps, etc. This helps to
  • keep Power BI at the top and famous, as it is continuously equipped with the latest features.

Power BI Training

  • Master Your Craft
  • Lifetime LMS & Faculty Access
  • 24/7 online expert support
  • Real-world & Project Based Learning

Now we will get into the power bi components in detail.

Power BI Components:

Here are the lists of power BI components. They are:

  • Power Query
  • Power Pivot
  • Power View
  • Power Map
  • Power Q&A
  • Power BI Desktop
  • Power BI Website
  • Power BI Mobile Apps

Power BI Components

Now start discussing each and every component of power BI in detail.

Top 50 frequently asked Power BI Interview Questions !

Power Query:

Power Query is one of the most essential components of Power BI. This would be included in your Excel or could be used as a Power BI Desktop component. Using Power Query, you can uninstall data from multiple data sources and retrieve data from a wide variety of different databases, such as Oracle, SQL Server, MySQL, and other databases. You can also retrieve data from records such as text files, CSV files, etc.

Power BI provides you a powerful GUI so that you really can change and use the information you need, such as date and time changes, add columns, modify types and content, and a variety of options. It includes a small language, Power Query M Formula Language, as a code that is more powerful than a GUI.Power Query Formula Language in Power BI is highly secure and optimized for the development of highly highly scalable mashup queries accessible to Power BI Desktop and Power Query. It has several features that cannot be made available by a GUI.

Power Pivot:

Power Pivot is a data designing and information technology engine. It’s being used to model static and dynamic data. You can establish or generate relations between various tables in Power Pivot and quantify values that can be considered in Pivot tables. It provides a tremendous opportunity to build your design.The language used mostly by Power BI Pivot is Data Analysis Expression (DAX), a highly functional language. 

HKR Trainings Logo

Subscribe to our YouTube channel to get new updates..!

Power View:

Power View is a major aspect of Power BI data visualization. It is an immersive device that connects to data sources and collects metadata that can be used for data collection. There are a lot of image processing blueprints in the Power View list. With Power View, you could even process the data for each visualization element or for the entire report. Slicers can be used to make better dicing of the information.Power View reports are responsive; the user can illustrate some of the data or components in Power View to communicate directly with each other.

Power Map:

Power Map is used to display spatial information in 3D mode. As soon as the visual interface is rendered in 3D mode, it offers some other dimension. In Power Map, one characteristic can be assumed to be the length of a column in 3D and another attribute to be a heatmap view. The data can be illustrated on the basis of a geographical location. Geographical locations may be a country, state, city, or street address.In order to get the best view, Power Map works with Bing Maps related to geographical latitude or longitude or country, state, city or street address data.

Power Q&A:

Power BI Q&A is a common language engine for questionnaires about your data model. After you have assembled and updated your data model on the Power BI website, you or your customers can ask questions, if any, and find solutions to those questions. There are a few shortcut keys and hints for the development of your framework so that it can respond to questions in the most effective manner possible.

For data visualization, Power Q&A works with Power View so that users can ask any questions, such as the amount of clients per state, and the question is responded in the form of a map view with numbers shown as bubbles by Power Q&A.

Want to know more about Power BI,visit here Power BI Tutorial !

Power BI Desktop:

Power BI Desktop is a continuous improvement of the Power BI suit. This is an embedded development tool for Power Query, Power Pivot and Power View. It allows you to build advanced queries, models, and reports. Power BI Desktop makes it easy to advance your BI skills and your data analytics experience.

Power BI Website:

Power BI solutions can be compiled on the Power BI website. You can generate dashboards for your news stories and share them with others, and you can also generate content directly on the Power BI website. With the Power BI website, you can conduct slice and dice online operations using a web browser, and you don’t even need any other tools.

Power BI Mobile Apps

Power BI Mobile Apps has three mobile operating system (OS) providers: Android, iOS, and Windows. These frameworks give you lots of an immersive view of Power BI reports and dashboards. You could even share them with your mobile app. A fraction of the documents can be displayed and a note can be written and shared with others. 

To gain in-depth knowledge with practical experience in Power BI, Then explore hkr’s Power BI Training In Hyderabad !

Power BI Training

Weekday / Weekend Batches

Conclusion:

In the above content, we had covered all the important components of power BI in detail. One can take a sound knowledge in the power BI technology by learning each and every components of the power BI architecture. However, the above stated information is strong enough to make you realize the importance of the power BI in corresponding to the data visualization, data analysis, etc.

Related Articles:


Source link