After locking lips with Jimmy Fallon earlier in the week, Stephen, 62, ended up kissing his two famous guests during the Tuesday (May 12) episode of The Late Show.
Credit: CBS
First up was Julia Louis-Dreyfus
As Julia Louis-Dreyfus talked to Stephen, the late-night host played a clip of guests he’s kissed over the years, including Sally Field, Helen Mirren, Allison Janney, Andrew Garfield, and Jeff Daniels.
The 65-year-old Veep actressthen stared at Stephen before joking, “No one’s watching, it’s just between us.”
As they inched closer to each other’s faces, the two referenced each other’s spouses: “Brad [Hall] is larger than I am,” Stephen said as Julia added, “Evelyn [McGee-Colbert] is stronger than I am.”
After a peak on the cheek and cheers from the audience, Julia encouraged Stephen to do a “reshoot” and they locked lips.
Credit: CBS
Pedro Pascal also got his opportunity to kiss Stephen!
Later in the episode, Pedro Pascal appeared on the late-night show to chat about his new movie The Mandalorian & Grogu.
When he sat down, Pedro, 51, pointed at his lips and raised his eyebrows, which led to kissing Stephen.
“I got jealous,” Pedro admitted.
“No need, any time,” Stephen responded. “These lips will soon be free.”
Once The Late Show is officially over (the final episode airs on May 21), StephenColbert will be moving on to different field entirely as he writes a new Lord of the Rings movie.
Browse through the gallery below to see more photos from the Wednesday episode of The Late Show…
Using AI assistants to generate text, images, audio, and more is just a common task today. But have you considered generating an important percentage chart with the power of AI? Well, that’s now possible!
Anthropic has now announced an upgrade to its AI assistant Claude (Claude 3.5 Sonnet), following its immense popularity and ranking as the Top free app on the App Store. Claude can now create interactive charts, diagrams, and visuals within the conversation. It’s making the chatbot by explaining concepts. The AI assistant can generate visuals when asked or even decide whether visuals would be helpful to users.
To help you better understand the newly launched visualization feature, we have put down all the details in the blog. Let’s begin!
What is the New Visualization Feature?
The new visualization feature is Anthropic’s upgraded version of Claude, which marks a major shift from text-based content to interactive & visual-based communication. It can now generate graphs, charts, diagrams, and other visual outputs directly in the chat interface in real time.
This opens a new learning experience for users. The visuals support technologies such as HTML, JavaScript, CSS, and SVG, allowing them to perform certain actions. The visualization feature differs from the previous approach, Artifacts, which showcased the content in a separate side panel. However, users can now see everything in the chat interface or responses without downloading any external tools.
How to Generate Charts and Diagrams Using Claude AI?
There are two scenarios: you can either ask Anthropic Claude AI to generate the diagram, chart, etc., with a prompt. Or Claude may suggest the best visuals when it understands that sharing a diagram can help clarify the concept.
The following are some of the best prompts users can ask:
Draw this as a diagram to explain the concept
Visualize how it would look over time
After the results are created, users can ask:
Make changes such as zooming out, sharing follow-up prompts
The visualization evolves as the conversation keeps going
Claude refines the diagrams and charts accordingly.
Some Examples by Anthropic Claude AI:
The following are some of the examples mentioned by Anthropic Claude AI:
“You can ask Claude how CI works, and it will share a curve you can work with.”
Also, ask about the periodic table, and it builds an interactive visualization you can click for additional information.
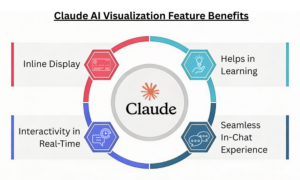
Benefits of Claude AI Visualization Feature:
Inline Display: The visualizations are inline, not in the side panel. They are temporary and change as the conversation progresses.
Interactivity in Real-Time: In comparison to the static graphs, inputs can be changed, and results can be made more dynamic in real-time.
Helps in Learning: Visual representations have a greater impact than text and make it easier to explain a particular concept. Ideal for teachers, students, and more.
Seamless In-Chat Experience: Users get the desired results directly in the conversation, eliminating the need for additional design software.
Limitations to Know:
The feature is currently available in web versions but does not support mobile apps.
It’s still in development, which can lead to inaccuracies or rendering issues.
Although the visualization feature aids faster decision-making, it is not a replacement for tools and apps such as Tableau or Excel.
How About Availability?
The visualization feature is currently available to everyone across all the Claude plans. However, despite its availability, it’s in beta. So, users on free tiers can give it a try and generate charts, diagrams, or visuals with a simple prompt.
Summing it Up!
The new feature comes amid growing competition among AI players. This Tuesday, OpenAI launched dynamic visuals in ChatGPT, and Google unveiled interactive charts and simulations for Gemini Ultra subscribers.
Anthropic’s new update focuses on a significant push towards format-specific results. By introducing charts, diagrams, and maps directly into the conversation, Anthropic aims to make understanding easier with visuals rather than long-form text.
Don’t miss out on the recent technologies and innovations; check our blog section now!
FAQs
1. Does the feature work on mobile? Answer: As of now, the feature is available in web versions but not in mobile applications.
2. Are the visualization capabilities available through the API? Answer: Yes! The visualization capabilities can be accessed through the Claude API, Google Cloud’s Vertex A, and Amazon Bedrock.
To provide the best experiences, we use technologies like cookies to store and/or access device information. Consenting to these technologies will allow us to process data such as browsing behavior or unique IDs on this site. Not consenting or withdrawing consent, may adversely affect certain features and functions.
Functional
Always active
The technical storage or access is strictly necessary for the legitimate purpose of enabling the use of a specific service explicitly requested by the subscriber or user, or for the sole purpose of carrying out the transmission of a communication over an electronic communications network.
Preferences
The technical storage or access is necessary for the legitimate purpose of storing preferences that are not requested by the subscriber or user.
Statistics
The technical storage or access that is used exclusively for statistical purposes.The technical storage or access that is used exclusively for anonymous statistical purposes. Without a subpoena, voluntary compliance on the part of your Internet Service Provider, or additional records from a third party, information stored or retrieved for this purpose alone cannot usually be used to identify you.
Marketing
The technical storage or access is required to create user profiles to send advertising, or to track the user on a website or across several websites for similar marketing purposes.