


MN breweries feeling pain as industry declines


People gathering outside of Bauhaus Brew Labs

The craft beer industry is hurting.

Bauhaus Brew Labs, the decade-old brewery, will soon be the latest in a list of Minneapolis closures: HeadFlyer Brewing closed in April and Dangerous Man Brewing shut down in 2023.

“I want to cry,” said Jana Brom-Palkowski, a Bauhaus employee for most of its 12-year existence. She said the brewery’s closure is a dagger to the northeast Minneapolis neighborhood.

“We've been through a lot in this city and in this neighborhood, and people have continued to show up and support us for so many years,” she said. “How can we walk away looking at that is nothing less than really lucky.”

Smaller taprooms are feeling the light dim on craft beer’s golden age. For over a decade the news about breweries wasn’t last call — it was mostly bottoms up.

The 2010s were a boomtime for craft beer. Taprooms popped up across the country, injecting new life into forgotten places — old factories, warehouses and the like with large open spaces, exposed brick and metal beams. The remnants of the industrial Midwest that sat vacant for decades were once again packed with a new generation of people eager to sip on a crafted lager, hefeweizen or IPA.

So, what happened?

The Brewers Association, an industry group, says there were around 9,000 breweries across the country by 2020. More than 450 taprooms opened that year alone, compared to just 128 that closed.

By 2024, there were more taprooms closing than opening. In 2025, 219 taprooms closed compared to 151 that opened.

It was the worst year since the trade group started keeping track in 2018. Some of those closures included Invictus Brewing in Blaine, Schram Haus Brewery in Chaska and Foremost Brewing Cooperative in Owatonna.

Mike Rulf, the CEO of Dual Citizen Brewing Company in St. Paul, has taken notice of the closings.
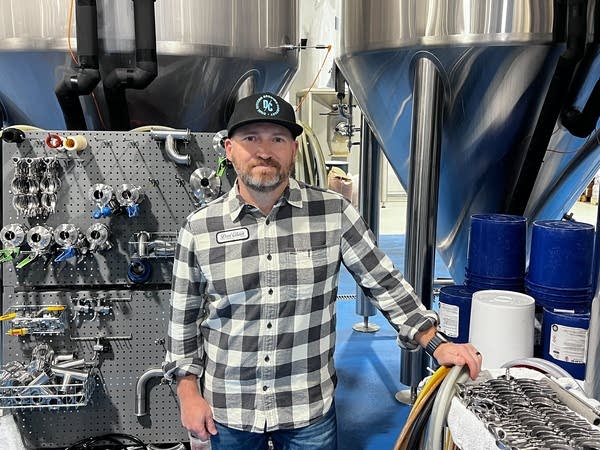
A man stands by a machine
Mike Rulf, the CEO of Dual Citizen Brewing Company in St. Paul, inside the Dual Citizen brewing facility that’s used to brew craft beer, THC drinks and can products for distribution on Friday.
Matt Alvarez | MPR News

Dual Citizen opened in 2018 — near the peak of the craft beer boom. Rolf says they're doing what they can to ward off financial headwinds. That includes crafting their own non-alcoholic beverages and THC drinks.

They also curate a welcoming environment for their Dual Citizen taproom with themed gatherings, game nights and fundraising with local nonprofits, Rulf said.

Each month, the brewery partners with a Minnesota nonprofit called Dual Purpose. The brewery will host events for a gathering of the community.

“This is what we're all about,” said Rulf. “We make it easy for people to get involved, and that's what keeps us going.

“People loved going to these taprooms and learning about beer,” Rulf said. “I still think people like to do that, but I think you have a shift in the culture of drinking that is changing.”

Rulf credited part of the shift to people making health conscious decisions by not drinking as much alcohol.

But there are also more options for those who continue to drink. The market has a plethora of alcoholic seltzers, THC drinks and mocktails.

In 2023, Dual Citizen built a separate brewing facility on the border of Minneapolis and St. Paul. The warehouse is used to can and distribute beer at a larger scale.

“Our biggest challenge is being able to sell beer profitably at scale in what is really shelf shrinking shelf space,” Rulf said.

He said Dual Citizen can produce about 2,000 barrels of beer a year out of the facility. That is miniscule compared to larger breweries with name recognition that can easily put out anywhere from 50,000 to 70,000 barrels.

Minnesota Craft Brewers Guild government and industry relations director Bob Galligan believes breweries are recovering from a multitude of events that was out of their control.

“I think there is an element of burnout that goes unrecognized,” Galligan said. “Obviously, the pandemic was was huge, but also the constant shift in trade policies, the constant shift in cost of goods. I do think that there are some owners who are just choosing to step away because running a small business has never been easy, but under these conditions it's unfair and nearly impossible.”
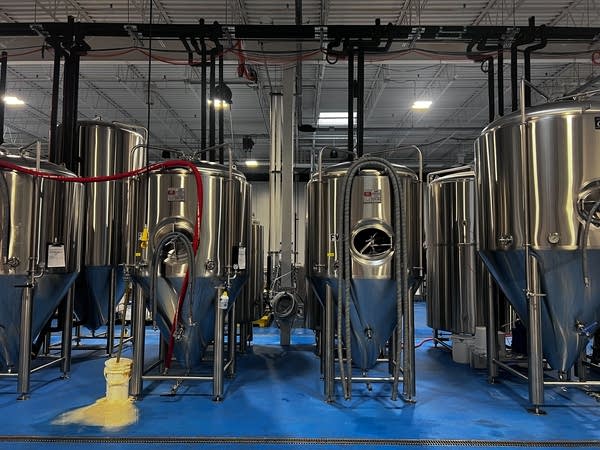
Brewing containers
Brewing containers inside the Dual Citizen brewing facility on Friday. These vessels are used to produce signature beers and THC drinks.
Matt Alvarez | MPR News

Galligan said he’s cautiously optimistic about the brewing industry, describing the slowing craft beer market as maturing or “hitting a cruising altitude.” Though he said Minnesota is grappling with a different set of circumstances.

Galligan feels the last three years has been difficult for craft brewers. Aside from regular market forces, Operation Metro Surge cratered outings at taprooms in the Twin Cities over the winter — as much as a 60 percent drop in business for some breweries.

“That's during January, which is already the slowest month of hospitality and beer,” Galligan said. “We can't find a way forward if we can't actually agree as to the fact that this has been impactful.”

Still, other factors are contributing to craft beer woes. In Washington, recent federal legislation threatens the future of THC drink production, which has been a lifeline for some brewers such as Dual Citizen.

A generational shift in drinking habits and views on consuming alcohol is already making breweries less relevant.

Overall, people are drinking less. That’s not lost on Galligan, who doesn’t put the blame solely on Gen Z. He sees the situation as a day-by-day learning experience and that Gen Z will drink what they want.

For now, the Bauhaus staff is aware that their time is running short. With weeks left until the brewery closes in June, Brom-Palkowski sees the laughs — and tears — while patrons share what they’re really losing while belly up to the bar.

“It's the end of an era,” Brom-Palkowski said as she looked out into the open-spaced taproom. “I will always have this family here and people that have really made a difference in my life through art and community.”



Source link

Leave a Reply

Subscribe to Our Newsletter

Get our latest articles delivered straight to your inbox. No spam, we promise.

Recent Reviews


Data Modelling in QlikView – Table of content

Introduction to QlikView:

QlikView is one of the top business intelligence tools which provide end-to-end platform services. The main operations of the QlikView tool included are data integration, user-driven business intelligence, and data analysis. The QlikView business tool helps users to convert the raw data into a useful one. This tool sometimes acts as a “Human brain” and mainly works on business associations. This software tool was first found in 1993 in Lund, Sweden, and is now based in King Of Prussia, Pennsylvania, United States.

As is said earlier, QlikView is one of the most demanding business intelligence tools. This tool is used to maintain the relationships between the data and visual colors. Users can also perform direct as well as indirect searches by using various searches in the given list boxes. One more important thing about QlikView is that this helps in the calculation of aggregated data and data compressions. Neither users nor software developers of the QlikView application manage the relationship between the various data sources, but this is managed automatically (you can say by default it happens).

Take your career to next level in Qlikview with hkr. Enroll now to get QlikView Online Training demo!

Major features of QlikView:

QlikView’s business intelligence tool comes up with advanced features. Following are the list of QlikView features:

1. Automatically maintains the data association:

QlikView tool automatically identifies the relationship between the data present in a data set. With the help of this feature, users need not recognize the relationship between the various data entities.

2. Data will be held in the memory available for multiple users and offers a super-fast user experience:

Here the data structure and calculations of a data report will be held in the RAM memory of the server.

3. Aggregations can also be calculated on the fly:

As data will be held in memory, the user performs a calculation task on the fly. Here there is no need to store pre-calculated aggregate data values.

4. Data will be compressed to 10% of the original size:

QlikView platform developed on the base of data dictionaries. Only essential data sets will be used for analytical purposes and this compresses the original data to a small size.

5. Visual relationship by using colors:

With the help of this feature, the relationship between the data will not be shown by lines and arrows. All you need to do is select a piece of data by click on specific colors to specify the related data and another color to specify unrelated data.

Qlikview Training Certification

  • Master Your Craft
  • Lifetime LMS & Faculty Access
  • 24/7 online expert support
  • Real-world & Project Based Learning

What is data modeling in QlikView?

A data modelling in QlikView is nothing but a pictorial representation of data tables that present in the various database servers, which also include associated relationships to show the data flow process of the entire system or model. This data modeling also helps to define the key fields and data dependency factors that help to perform the normalization and simplification process. The data modelling also a combination of dimensional tables that are linked to represent the fact table and also ends up with a star schema that helps to trade off on the available resources.

QlikView also performs in a good way when the data model is well structured and designed. A good data model also ensures that the quick data process provides accurate results, and evaluates the expressions. Data modeling in QlikView also consists of dimensions and key values within the data fields.

Best techniques used to perform Data modelling in QlikView:

The following are the important key techniques used to perform the data modelling process:

1. Using QVD files to increment data loads:

While performing the data modelling technique, the incremental load is a very common task in the relation to the database servers. It is defined as data loading (which helps to define new or modified records from the various database servers). All the data records will be stored in the QVD file formats.

The following are the important steps that will be considered to perform QVD files increments:

1. First you need to load the data from the database tables (this is considered to be a slow process, but helps to load the limited number of data records).

2. Next you need to load the old data from the QVD files (helps to load the data records in a faster way).

3. Now you need to create the QVD file formats.

4. You need to create the procedure for every table you loaded.

Get ahead in your career with our QlikView Tutorial !

2. Combining the data tables with Join and keep tables:

We already know that join takes any two different tables and combines them into one table. This process is also known as the “natural join table”. In QlikView, this type of join process can be done by using scripts and also logical data tables’ formats.

Let me explain these two methods in brief:

1. Join:

The easiest way to perform the joins process with the help of the join prefix in the script. The join is an internal table with another name table or previously created tables. The join usually used here is an outer join and used to combine values from the two tables.

For example:

LOAD a, b, c from table1.csv;

JOIN LOAD a, d from table2.csv;

2. Keep:

This is one of the main features of QlikView and helps to associate between any two tables instead of joining them. These keep features also help to reduce the memory space, increase the speed and enormous flexibility. The keep functionality helps to reduce the number of cases where the user needs to make use of explicit joins. In general, the Keep prefixes between two statements are LOAD and SELECT.

Acquire Data Modelling certification by enrolling in the HKR Data Modelling Tutorial program in Hyderabad!

HKR Trainings Logo

Subscribe to our YouTube channel to get new updates..!

3. Using mapping as an alternative to the joining process:

The Join prefix is a powerful method used to combine several data tables in QlikView. You can also find one disadvantage of using this Join prefix is that while combining larger and big data tables will reduce the performance. To overcome this hurdle, now we have come up with Mapping, this mapping method consists of two columns they are; a comparison field (as an input) and a mapping value field (as an output).

4. working with cross tables:

A cross table is a common type of data table that performs a matrix of values between any two orthogonal header data lists. The crosstable is often preceded by a number of various qualifying columns; you can read them in a straightforward way.

5. Using Generic databases:

A generic database is a kind of table in which all the field names will be stored as field values in one table column, where the field values will be stored in a second. Generic databases are usually used to define the attributes of different objects.

6. Matching intervals to discrete data:

The interval values can be defined using two prefix statements they are; LOAD and SELECT. These statements are used to link the discrete values with the two or more numeric intervals. This is one of the powerful data modelling techniques used in QlikView nowadays.

Top 30 frequently asked QlikView interview questions & answers for freshers & experienced professionals 

7. Creating a data interval from a single date:

Sometimes, when you are working with data modelling, usually the time intervals are not stored with a beginning and end of the time limit. Suppose if you don’t create any data interval, then the date value will be implied by only one field or the change timestamp.

8. Hierarchies:

In data modelling, n-level of hierarchies are used to represent other data fields (geographical and organizational dimensions in the data). These types of hierarchies are usually stored in any adjacent table nodes, for example, each record stored as a node, and the field represents the reference to the parent node.

9. Semantic rules:

Usually, semantic tables are not displayed in the table field viewer.

Below are a few semantic rules:

1. The semantic table should contain three or four columns.

2. The prefix statements like LOAD and SELECT load the semantic table and this table should be preceded by a semantic qualifier.

3. A semantic table either contains a relation between field values of the different fields or field values of the same field. One more important point to be remembered here, a mixture between these two will not be accepted.

10. Data cleansing:

When you load the data from the various tables, the field values will not be named consistently. Data cleansing is required, when there is a lack of consistency, and hinders association.

Qlikview Training Certification

Weekday / Weekend Batches

Conclusion: 

The data modelling in the QlikView blog helps users to create a structured and well-designed data model in QlikView. We have also discussed the top 10 best practices used in data modelling. With the help of data modelling users can understand the data landscape and also enables the organization to analyze and data extraction. Data modelling is considered to be a very important method in many business intelligence tools to perform data analysis and visualization tasks.

Other Related Articles:


Source link