How to get the most out of a tank of gas


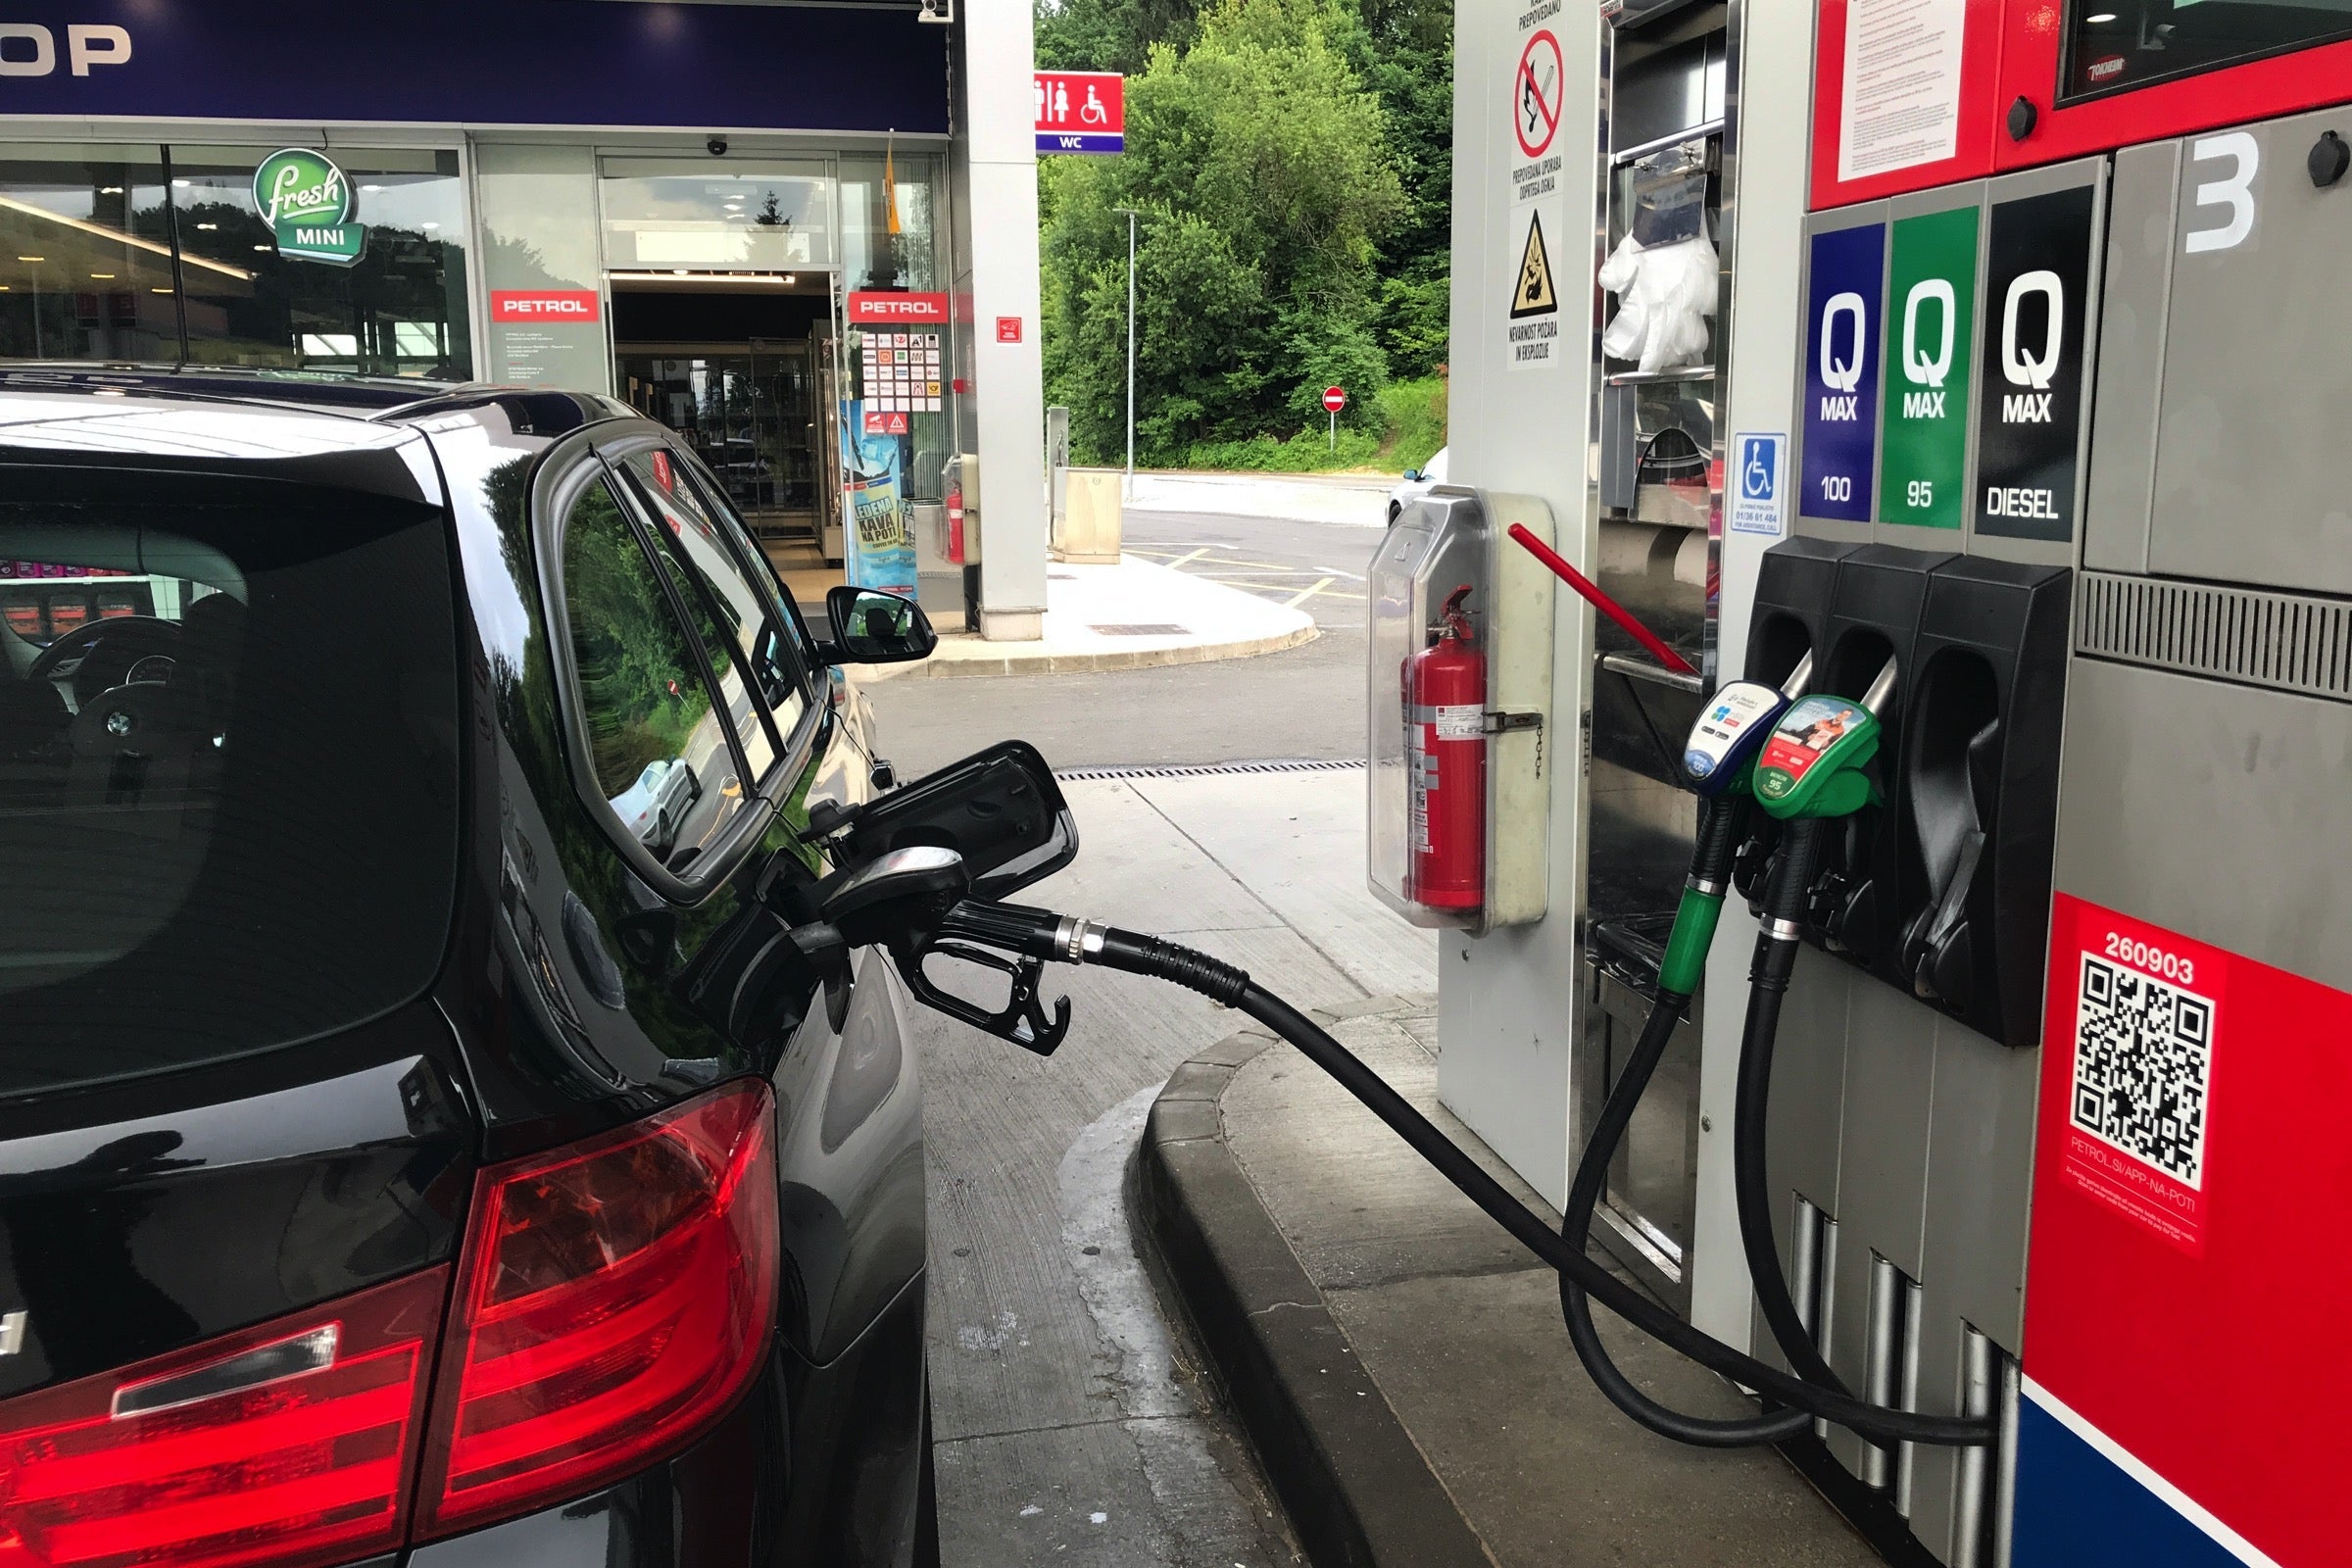
The conflict in the Middle East and associated oil price spikes are expected to impact not only airfares but also the cost of gas for everyday consumers.

The national average price at the pump is currently $3.88 per gallon (per AAA), nearly a dollar higher than the average a month ago ($2.90 per gallon). Motorists are already feeling the squeeze, and it will likely get worse as we head into the spring and summer travel season.

The good news: There are plenty of simple and creative ways to save money on gas. The goal is to maximize your fuel economy so that you can get the most miles out of a tank of gas — this post will show you how to do just that.

Related: Best credit cards for buying gas

Obey speed limits

CARLY HELFAND/THE POINTS GUY

If you’re among the many drivers who often go faster than the posted speed limit (guilty!), you’re not just risking a ticket. You’re also increasing your fuel consumption.

While the optimal speed for fuel economy varies from vehicle to vehicle, gas mileage tends to tank (no pun intended) at speeds above 50 mph. According to the Department of Energy, every 5 mph you drive over 50 is equivalent to paying an additional 27 cents per gallon for gas.

Slow down, and you may find yourself filling up less often — and putting dollars back into your wallet.

Related: The 12 best road trips to take with your family this summer

Drive conservatively

MARIA ARGUTINSKAYA/EYEEM/GETTY IMAGES

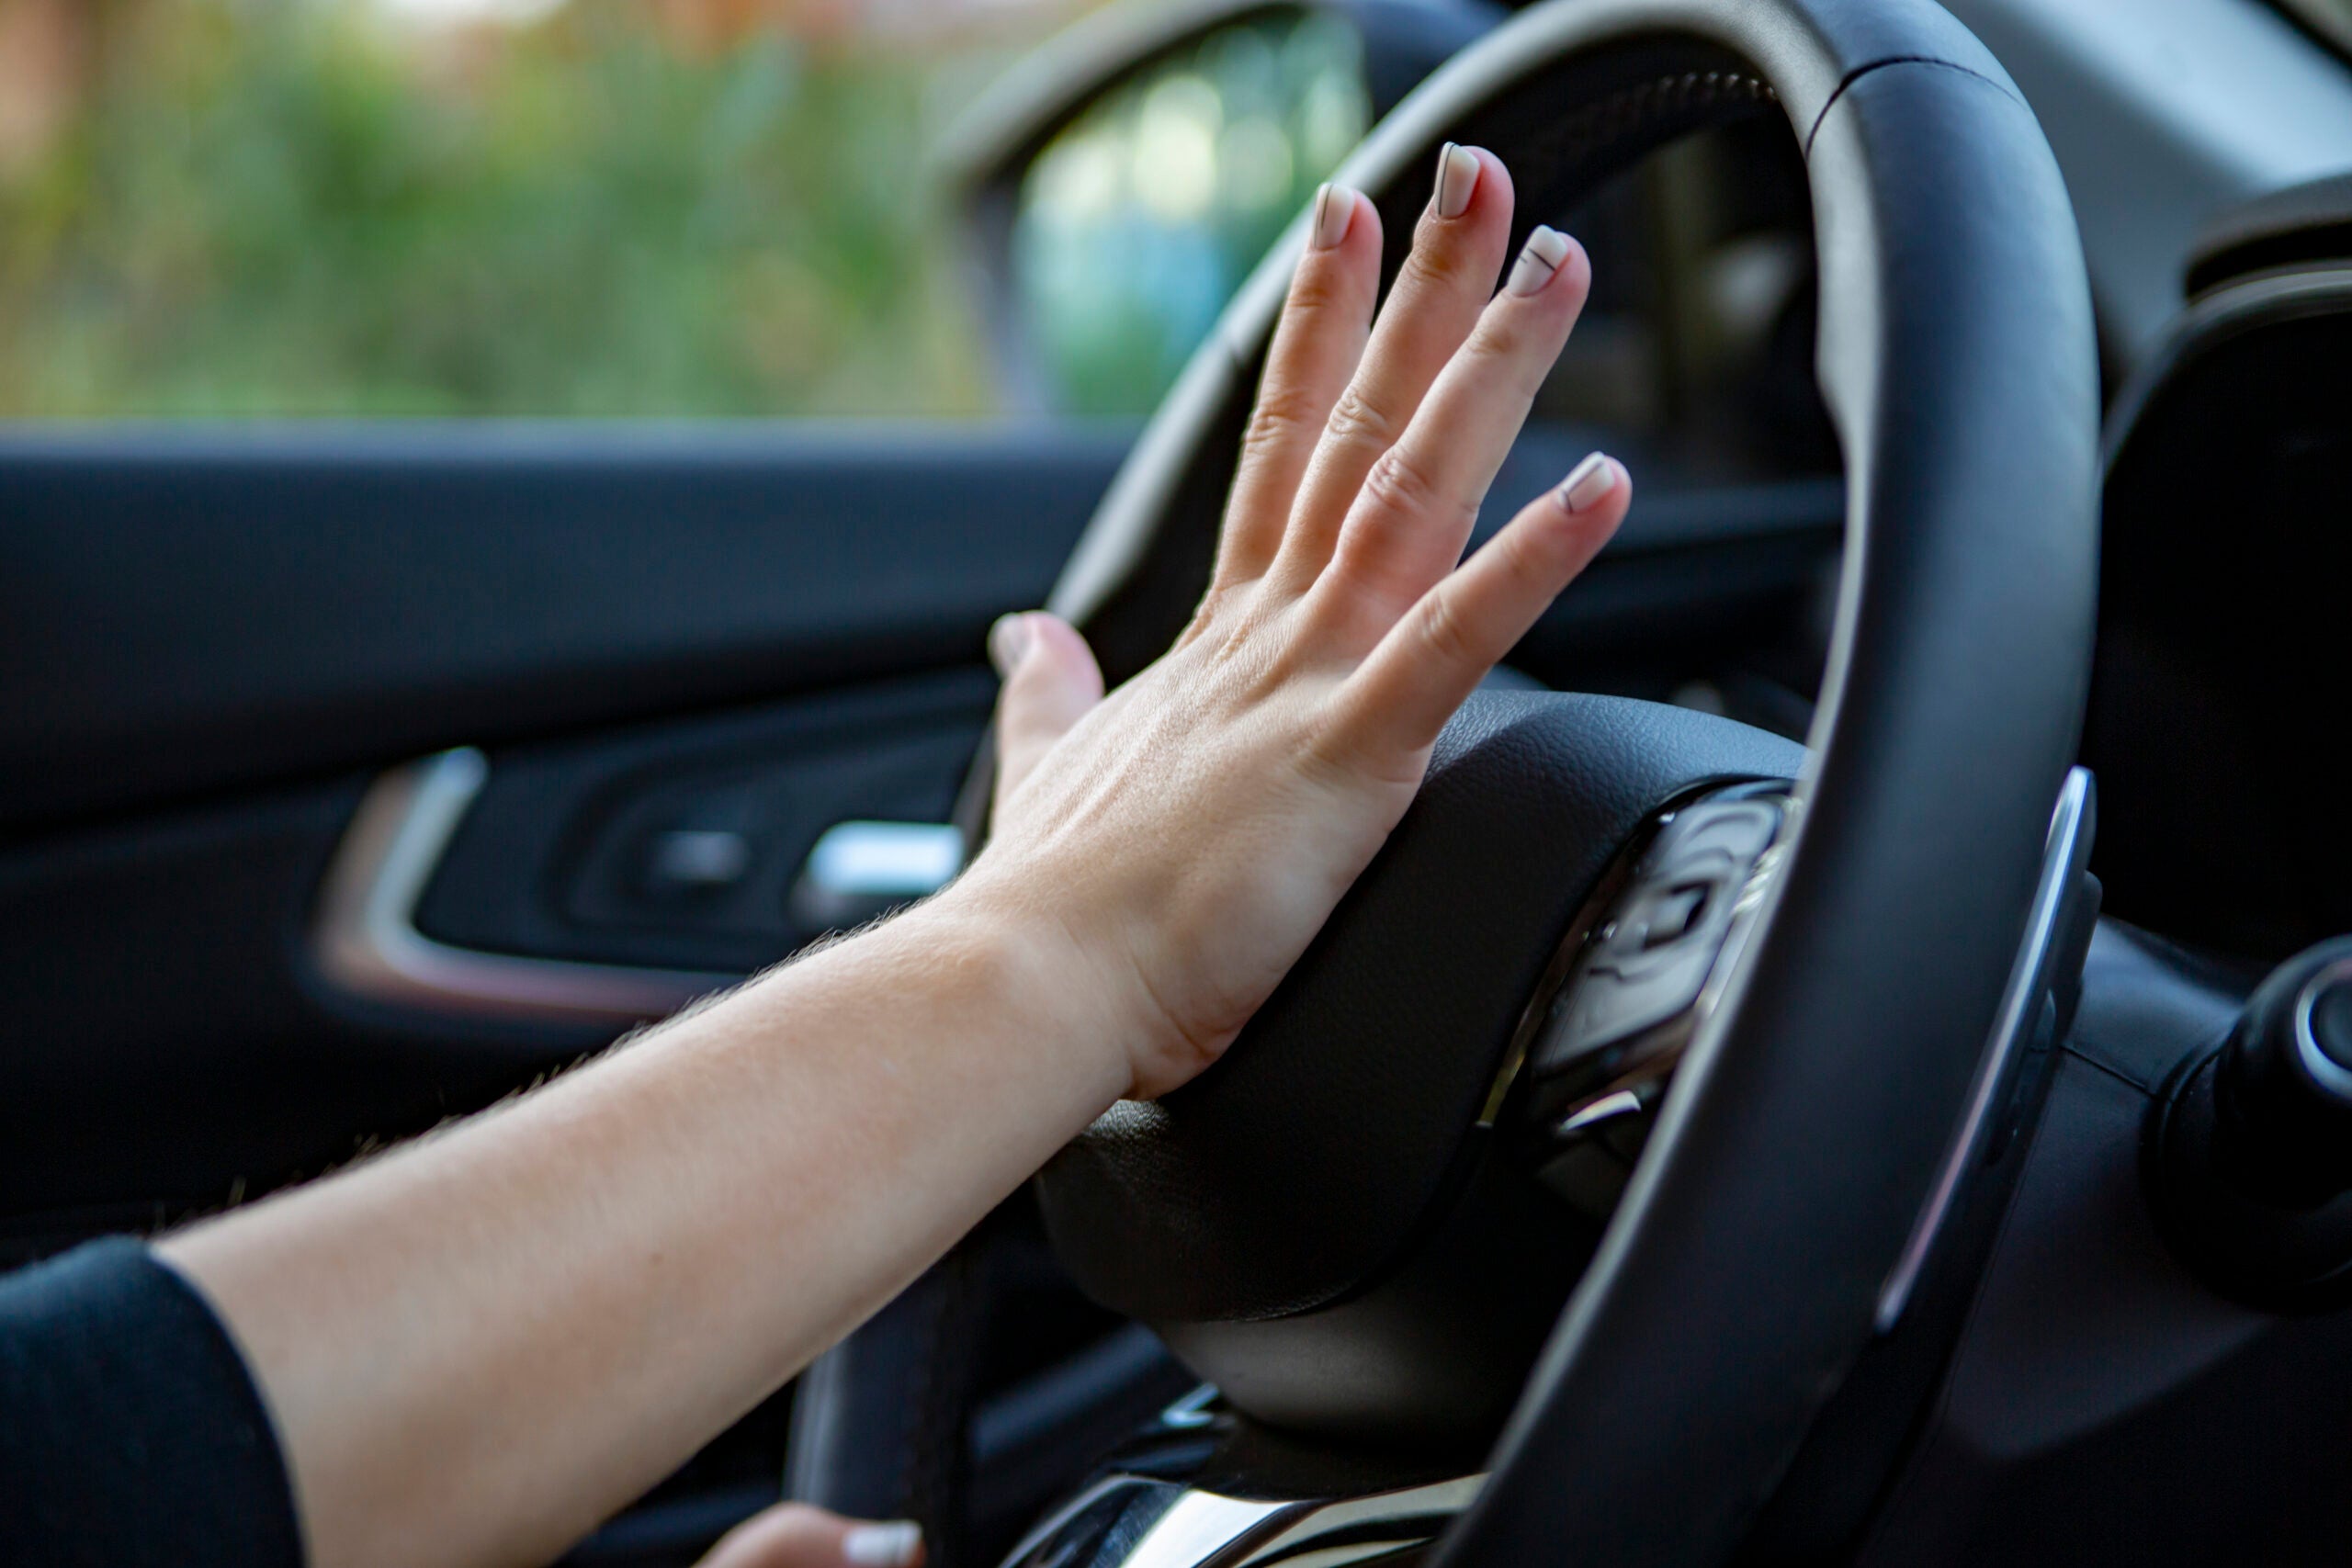
AAA encourages drivers to avoid rapid acceleration and hard braking, as these habits can lower your fuel economy by 15% to 40%. The harder you accelerate, the more fuel you use, and unnecessary braking wastes fuel you’ve already spent to get up to speed.

Reward your inbox with the TPG Daily newsletter

Join over 700,000 readers for breaking news, in-depth guides and exclusive deals from TPG’s experts

The smoother you drive, the farther you can stretch your tank of gas. Leave plenty of space and anticipate traffic patterns as much as you can to avoid sudden starts and stops. Focus on maintaining a consistent speed on the highway — cruise control can help, but don’t use it in slick conditions, as this can cause a loss of vehicle control.

Smooth driving will also help extend the life of your engine, transmission, brakes and tires, according to Consumer Reports.

Related: How to never pay full price for a rental car

Keep tires properly inflated

TIM STOCKER PHOTOGRAPHY/GETTY IMAGES

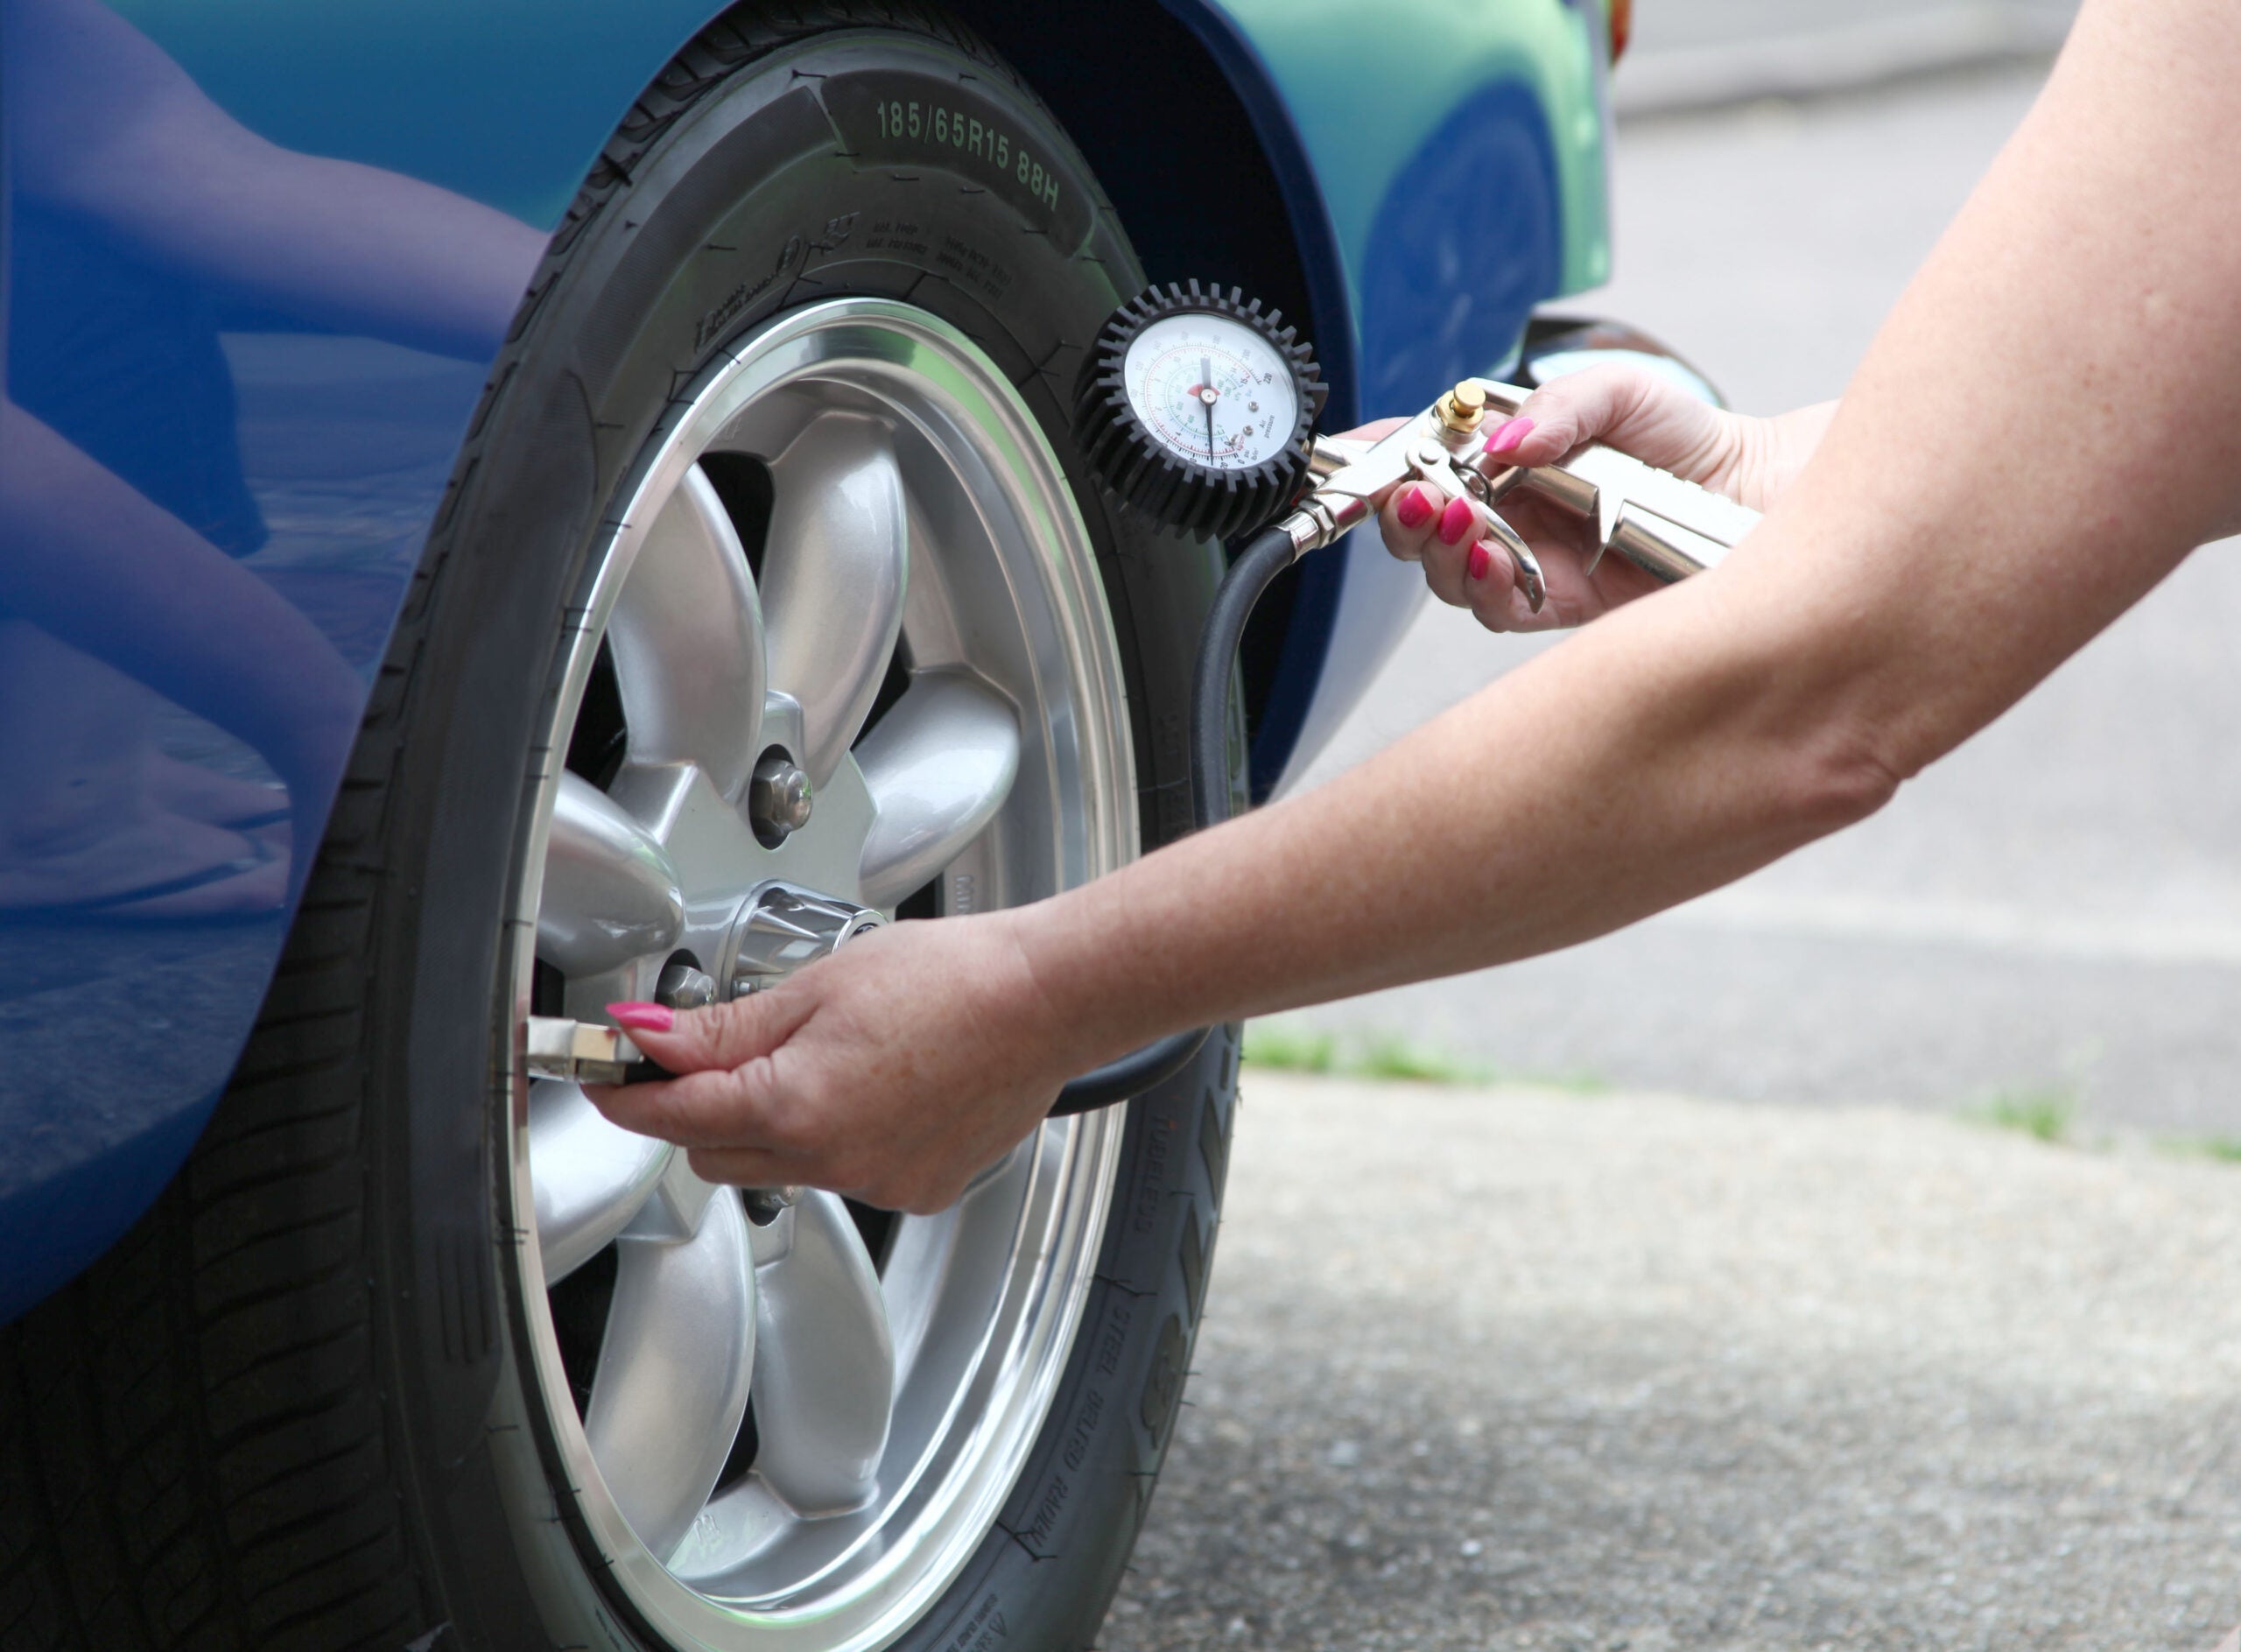
Tires might not be the first thing to come to mind when you think about fuel efficiency, but neglecting them can cost you in the long run.

Kelley Blue Book notes that underinflated tires flatten slightly against the road, increasing what is known as rolling resistance; the higher the resistance, the more fuel the engine burns. Tires naturally lose 1 to 3 psi per month, according to United Tires, and they can lose more if the air temperature drops or they spring a leak.

Check your tire pressure regularly and pump them up as needed to reach their ideal pressure. (You can usually find this information on a sticker inside the driver’s door jamb.)

Related: Route 66 road trip planner: The best stops along the way

Minimize idling

Melinda Podor
MELINDA PODOR/GETTY IMAGES

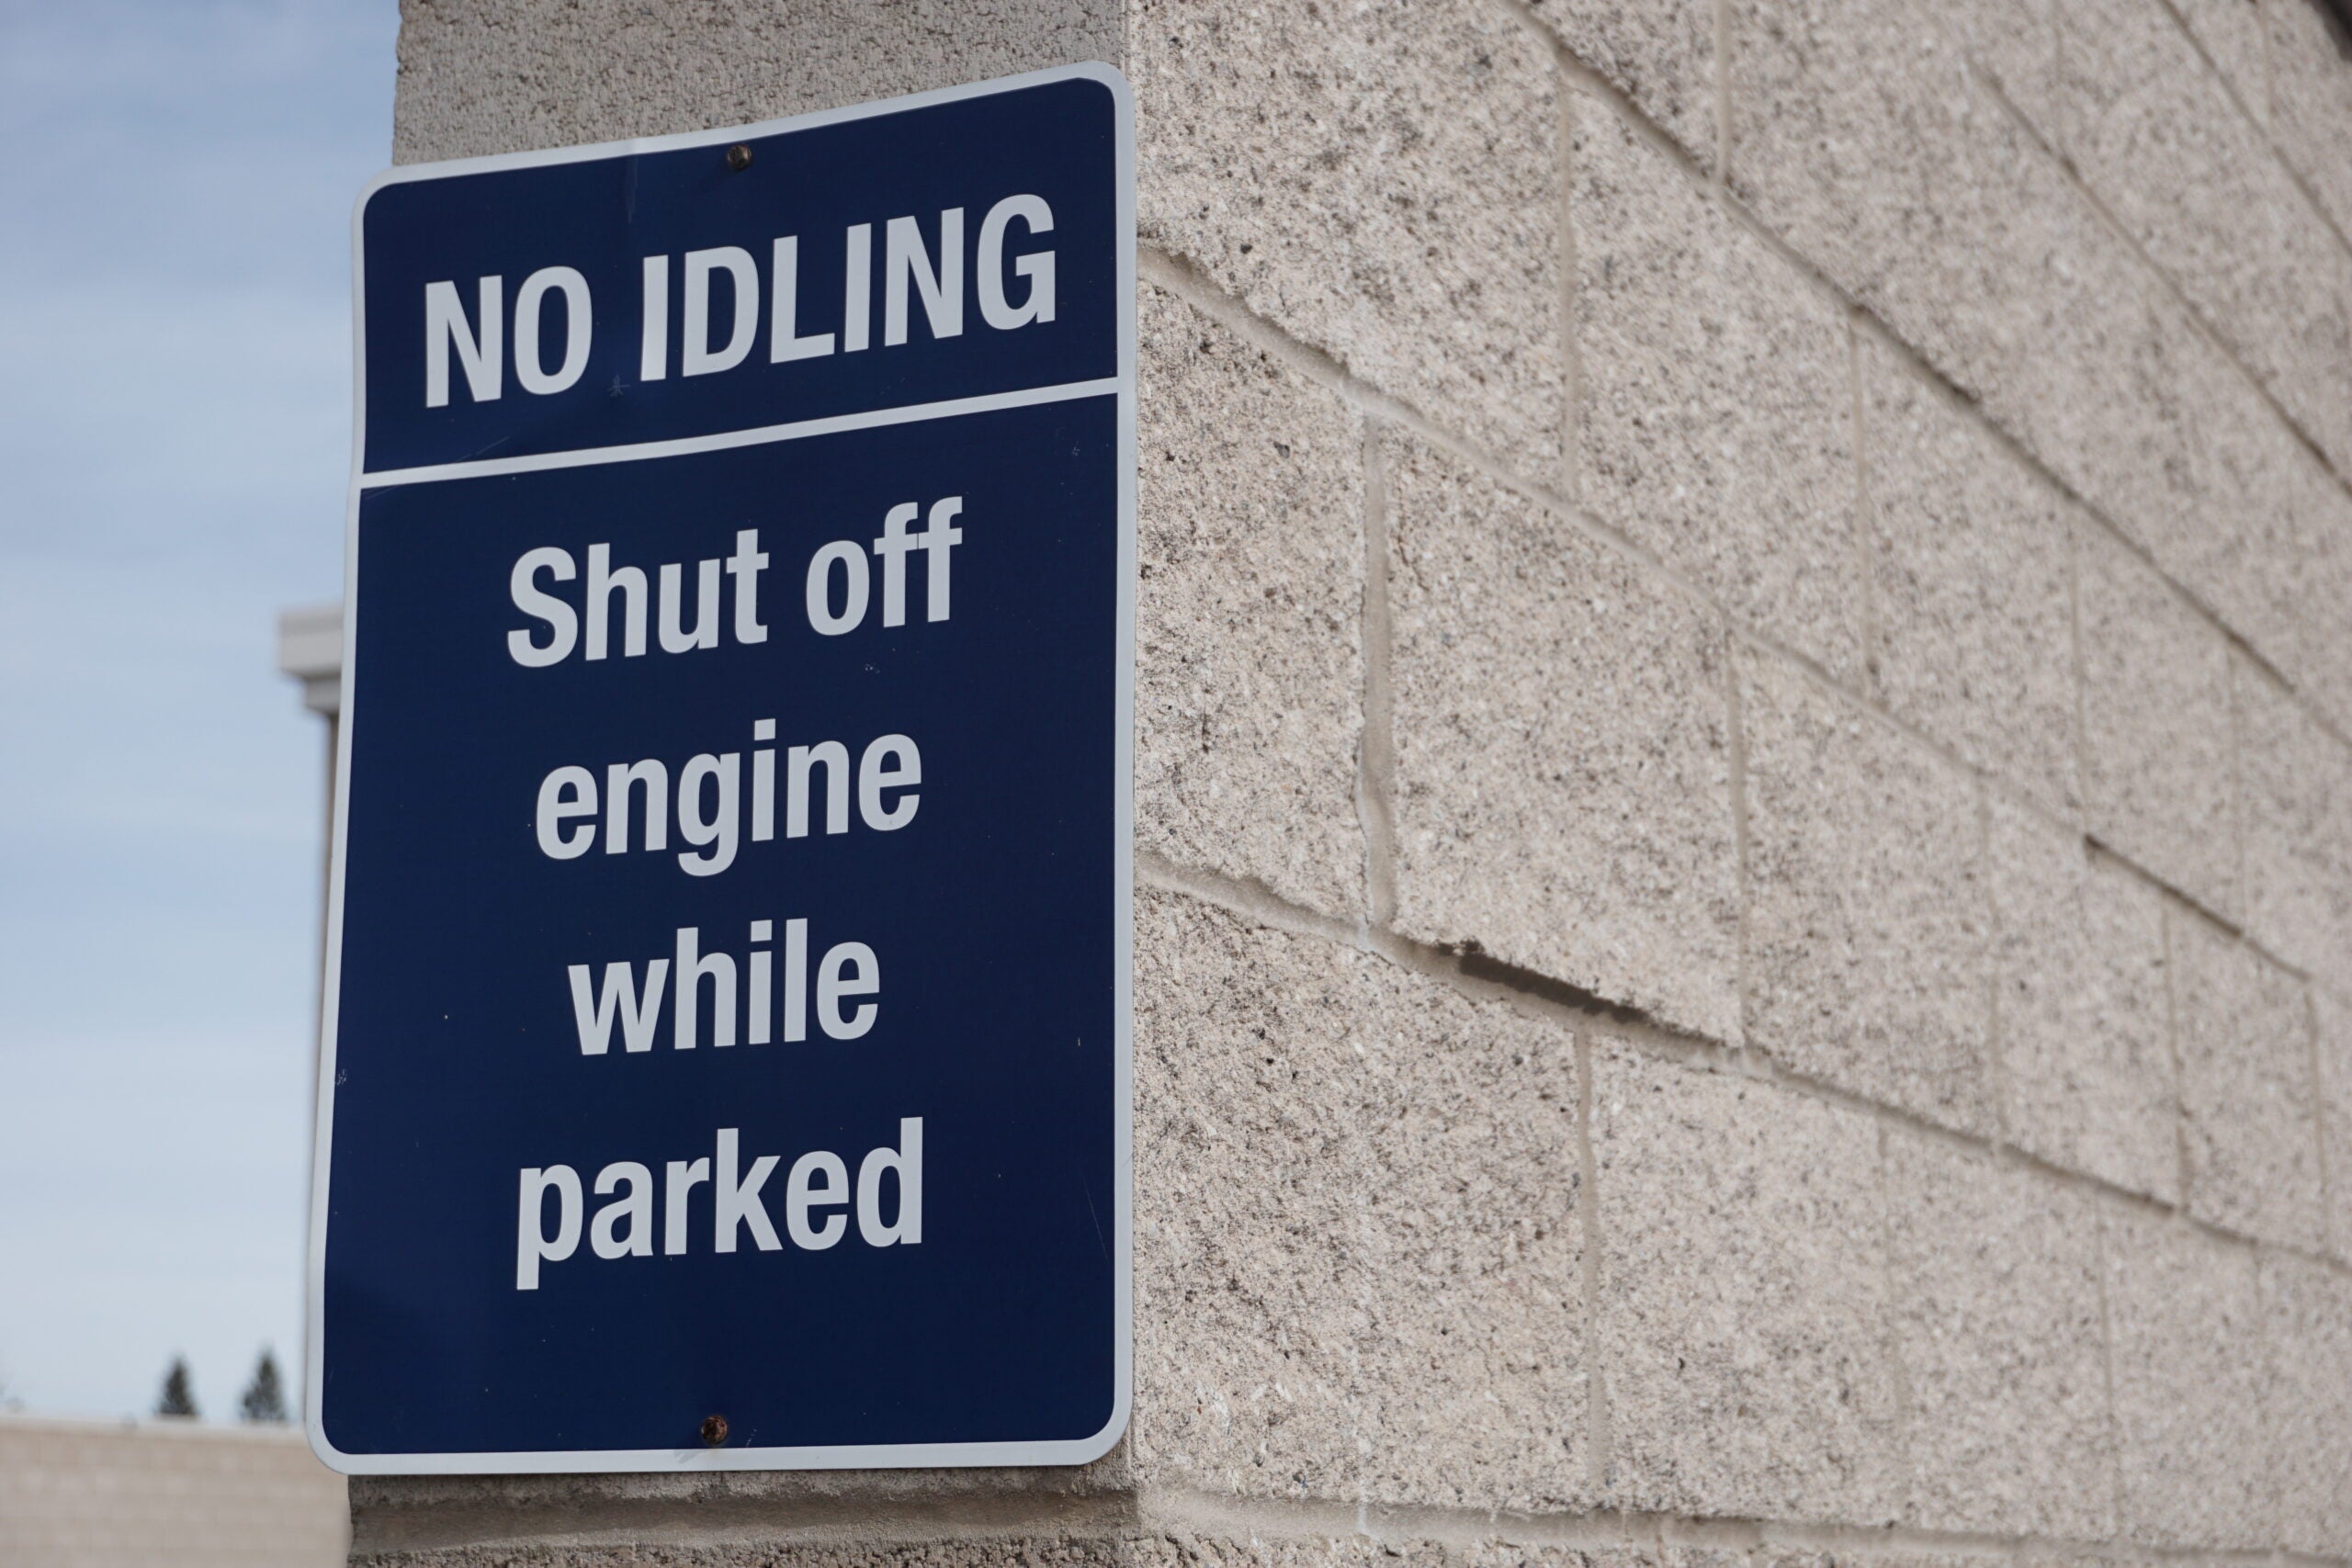
Many drivers have heard that it is more fuel-efficient to let your car idle than to turn it off and restart the engine, but this is a myth.

Since an already-warm engine only needs around 10 seconds’ worth of fuel to restart, more than 10 seconds of idling will actually use more gas than restarting the car, according to Utah’s Department of Environmental Quality. You’ll come out ahead if you turn your car off, as long as it’s safe to do so.

Similarly, letting your car warm up for long periods in the winter wastes gas, and it’s really not necessary. The DOE advises that your engine will warm up faster when being driven, and that 30 seconds of warm-up time is all you need for most vehicles.

Related: 9 best rental car rewards programs you need to know about

Combine trips

Black BMW 3 series fueling at a gas station in Slovenia
RUDIECAST/SHUTTERSTOCK

Another obvious tip to save fuel is to simply drive less. Though walking or biking may not be feasible depending on where you live, one thing most of us can do is combine multiple trips.

For example, instead of running errands as they pop up, merge them into one big trip each week and map out the most efficient errand route. See if you can get multiple items at the same place, such as by sending prescriptions to your grocery’s pharmacy to avoid an additional trip to the drugstore.

This will cut down on your fuel consumption, particularly in periods of cold weather, when the DOE says car engines need more gas to warm up to their most fuel-efficient temperature. Fewer trips mean fewer starts, and thus less fuel spent.

Related: The best road trips for visiting national parks

Watch your cargo

BENEDEK/GETTY IMAGES

The more stuff you haul, the more gas you can expect to burn. The DOE notes that you could lose roughly 1% of fuel efficiency for every 100 pounds you add to your vehicle.

Even worse, hauling cargo on top of your car creates more wind resistance, forcing your engine to work harder. For example, a large rooftop cargo box can reduce fuel economy by 2% to 8% in the city — or up to a whopping 25% on the interstate. Yikes.

If you must haul external cargo, opt for a rear-mount box or tray, which will have a much lower impact on your mileage per gallon. And be sure to remove any cargo holders when they’re not in use, as Consumer Reports‘ testing showed that even empty holders can take a toll on your fuel economy.

Related: Common rental car mistakes — and how to avoid them

Stay cool the right way

Dog looking out of car window at coastline
PETER CADE/GETTY IMAGES

Running your car’s air conditioning does use additional fuel — up to 10% more, per Kelley Blue Book — so you might think you’re better off with the windows down. But there’s a tradeoff, because open windows create more wind resistance.

According to a study by the Society of Automotive Engineers, windows are the way to go at speeds below 45 mph. Faster than that, close the windows and switch to A/C.

Related: The ultimate Blue Ridge Parkway road trip guide

Bottom line

Watching gas prices spike is never fun, especially if you’re planning a road trip in the near future. While recent events may make you consider an electric vehicle, you don’t necessarily have to buy a new car to save on gas.

These tips will not only help you minimize your fuel consumption and save money, but also reduce your environmental footprint and keep your car in tip-top shape.


Source link

Leave a Reply

Subscribe to Our Newsletter

Get our latest articles delivered straight to your inbox. No spam, we promise.

Recent Reviews


How to open the Power BI service?

The following steps need to be followed to open the Power BI service.

Assuming the left route sheet is imploded, select the nav sheet symbol to grow it.

1. Select Learn and look down to Sample reports. Here is some example information to use for our visit through the Power BI administration. There is a wide range of test information given to you to investigate. This time, we’ll utilize the information about the open-door examination.

2. Select the sample to open it. The Opportunity examination test report begins in the Power BI administration.

3. The Power BI administration introduces the example in your My work area. My work area is your private sandbox for learning and testing. No one but you can see the substance in My work area. Select My work area to see insights concerning this example report.

The example incorporates one report and one dataset. Regularly, business clients will not get datasets, yet this example is intended for all clients, and it includes one.

As a business client, most happy that you are imparted will exclude direct admittance to the hidden datasets. Since the Power BI tests are made for all Power BI clients, datasets are incorporated.

Become a Power BI Certified professional by learning this HKR Power BI Training !

View content (dashboards and reports) :

Content is coordinated inside the setting of a work area. Each business client has no less than one work area, and it’s called My work area. At the point when originator partners share satisfaction with you, you might wind up with extra work areas. For instance, assuming an originator doles out your access consents to one of their work areas, that work area will appear on your Power BI site.

My work area stores all the substances that you own and make. Consider it your sandbox or workspace for your meaning. My work area stays void for some Power BI business clients because your occupation doesn’t include making new happy. Business clients, by definition, consume information created by others and utilize that information to pursue business choices. Assuming you observe that you are making content, consider perusing the Power BI articles for report makers.

A work area is significantly more than an essential posting of content. You can gain some significant experience with the work area’s dashboards and reports on this page.

In this segment of the instructional exercise, we’ll put the Opportunity examination test to the side for some time and take a gander at a work area with both a dashboard and a report. On the off chance that you might want to track, look down to the lower-left corner of the Power BI administration and select Get information > Samples > Sales and Marketing Sample > Connect. Resume My Work area to see your new satisfaction.

A work area is one of the ways into your information. You can open a dashboard or report from a work area by choosing it from the rundown. You can most love a dashboard or report by floating and selecting the star symbol. Assuming that the originator gave you sharing authorizations, you can share from here too.

We should begin by opening a dashboard.

1. Select the name of the dashboard to open it.

2. The dashboard opens in the Power BI administration. Dashboards are something that separates the Power BI administration from Power BI Desktop. Find out about dashboards.

3. The moves you can make on a dashboard are shown in the top menu bar. Select More activities (…) to see the total rundown.

4. The visuals on the dashboard are organized as tiles. Float over a dashboard tile and select More choices (…) to see your options for associating with that tile.

5. Select a dashboard tile to open the report utilized to make that tile. The report extends to the page containing the visual on the tile. Here, I’ve chosen the dashboard tile with the treemap. The Power BI administration opens the YTD Category report page.

Reports have a few areas. On the left is the interactive rundown of report pages. Across the top is the menu bar containing moves you can make with the report. The choices accessible will rely upon the job and authorization the reported architect allocated to you. On the right side is the Filters sheet. Also, the middle material contains the actual report. Like the dashboard, there are moves that you can make for the whole piece, for unique visuals and a solitary report page.

Power BI Training

  • Master Your Craft
  • Lifetime LMS & Faculty Access
  • 24/7 online expert support
  • Real-world & Project Based Learning

Using the left navigation pane :

The nav sheet will be more valuable as associates share satisfaction with you. In this part of the instructional exercise, we’ll take a gander at a dashboard and report that have a place with a Power BI business client who has a ton of shared content.

1. Home is the default greeting page when you sign in to the Power BI administration. Home is an excellent leaping-off point and substitute method for exploring your substance. Content on Home is coordinated in a few distinct ways: by suggested, top choices, later, and applications. The Getting begun area is handy for new clients, with tabs containing tests, documentation, and preparing content. Select a thing to open it.

Home unites the looking and arranging instruments, the nav sheet, and material with cards that you can choose to open your dashboards, reports, and applications. You probably won’t have many cards on your Home material from the outset. However, that will change as you utilize Power BI with your partners. Your Home material likewise refreshes with suggested content and learning assets.

2. Favorites and Recent both have bolted. Select a bolt to see the leading five top picks or five most recently visited content rapidly from the flyout, and select a substance to open it.

Select the word or symbol to see your complete rundown of top choices or recent ones. These substance records give insights into the reports, applications, and dashboards.

See Recents in Power BI and Favorites in Power BI to find out additional.

3. Select Apps to show all applications that have been imparted to you or introduced. Also, select Shared with me to see dashboards and reports imparted to you. These substance regions will be unfilled since you’re simply beginning with the Power BI administration.

Top 50 frequently asked Power BI Interview Questions !

HKR Trainings Logo

Subscribe to our YouTube channel to get new updates..!

Search and sort content :

Whenever you’re new to the Power BI administration, you’ll have a couple of bits of content. As associates start offering a range to you and you start downloading applications, you might wind up with extensive arrangements of content. That is the point where you’ll see looking and arranging incredibly accommodating.

Search is accessible from pretty much all aspects of the Power BI administration. Search for the hunt box or search amplifying glass symbol.

In the Search field, type all or part of the name of a dashboard, report, exercise manual, application, or proprietor. Power BI looks through the entirety of your substance.

There are likewise numerous ways of arranging content. Drift over segment headers and search for bolts showing that the section can be set. Not everything segments can be arranged.

Or on the other hand, search for the Search Filters close to the upper right corner of your substance records. Observe content rapidly by sifting for things like kind of satisfied or proprietor.

Filters

Steps to Create a Quick Report

In the Power BI service’s navigation pane, click the Create button to open a page where you can choose your data source. It’s also available from the New report button on the Home page.

create-entry-point

We currently only support creating a report based on an existing dataset or directly typing or pasting data into a table. Other sources, such as uploading an Excel file, will become available over time.

create-source-options

If you choose to type or paste data, you are presented with a grid into which you can begin typing. You can also use Ctrl + V or the context menu to paste data.

create-enter-data-window

Columns can be added and removed using the context menu. Select Use first row as headers if your pasted data contains a header row to promote the first row to the header row automatically. Power BI detects data types automatically, but you can also set them manually. Next to the column name, click the Data type button.

change-data-type

Power BI creates a new dataset for you and autogenerates a summarised view of your data as you go through the creation process. These automatically generated visuals get you from raw data to insights faster than ever before.

select-data-fields-generate-new-visuals

Altering the data in the report is also simple. To add or remove fields from the information, use the Your data pane. Select and deselect areas to change what you want to measure and analyze. Power BI generates meaningful charts based on your field selection.

Want to know more about Power BI,visit here Power BI Tutorial !

Power BI Training

Weekday / Weekend Batches

Conclusion :

Power BI documentation highlights some crucial steps in the complete tutorial or learning of power BI. These steps are straightforward to follow, and Microsoft has released several e-books to document them. If you have any queries, please write back to us.

Related Article :


Source link