As Hailey Robinson took to the track at this week’s Special Olympics USA Games in Minneapolis, she said one thought kept running through her mind: “Don’t slow down.”
To reach the starting line of that 800-meter race — and a second-place finish — Robinson didn’t just travel from Hibbing to the Twin Cities. It was a journey that started years earlier.
Robinson’s mother, Melissa Patterson, said the race brought back memories of how far her daughter has come.
“When I got her, she could only lay on the floor and flap her hands; she had no muscles,” Patterson said. “She didn't walk till she was over two years old, so to see her out there running is like the most amazing thing.”
Robinson, who’s 19 years old, is one of several thousand athletes taking part in this week’s Special Olympics USA Games, held at venues around the Twin Cities.
Patterson is Robinson’s cousin and adopted her when she was eight months old. Patterson signed her up for track when she was very young, and she’s stuck with it ever since.
Robinson has been involved in the Special Olympics since 2022, competing in bocce. swimming, poly hockey and track and field; and participating in the Polar Plunge. However, in this year’s games, she decided to stick with track and field.
Away from competition, Robinson draws and creates art, including painting, which she said is her “No. 1 passion.” She said her disability empowers her to take on so many activities at once.
“For some people, some other people tell them that they can't do it because of their disability, but that's not true,” she said. “Even if you have a disability, it does not mean you can't do something, you still have the ability to do it.”
Robinson said the Special Olympics unites people because there is no judgment, and it allows people with disabilities to show what they can accomplish.
Patterson said Robinson is no different than everyone else.
“I cry every time she runs, because she just inspires,” she said.
Special Olympics USA Games events are being held at the National Sports Center in Blaine, and on the University of Minnesota campus. The games continue through Friday.
Power BI is a cloud-based business analysis and intelligence agency developed by Microsoft. It is a compilation of business intelligence and data analytical techniques, such as software services, applications and data connectors. We can use data sources extracted into Power BI to visualize and analyze data using shared reports, dashboards, and apps.Power BI is a user-friendly tool that offers remarkable drag-and-drop features and self-service abilities.
Microsoft is offering three types of Power BI platforms:
Desktop Power BI(A desktop application)
Power BIService (SaaS i.e., Software as a Service)
Mobile Power BI (For iOS and Android devices)
We can also deploy Power BI on both on-site and cloud platforms.
Why Power BI?
Power BI is an integrated system with several various types of data under its supervision.There seems to be a cloud-based BI service called Power BI Services that is used to display and communicate dashboards.A desktop-based report functionality known as the Power BI Desktop.Another useful service is Power BI Embedded, which keeps running on the Azure cloud platform and can be used for reporting, ETL and data analysis.
Now we discuss why it is an important tool in the present market.
One can easily do real time analysis in power bi by creating direct connections with the data sets.
Can take the advantage of the custom visualizations.
Can get the quick insights of the data.
Power BI marketplace as on-site communications make data transfer secure and technology scalable and reliable.
You can attach to other services via Power BI, such as SQL Server Analysis Services (SSAS), Microsoft Excel, etc.
Power BI is a new age application that helps state-of-the-art technologies such as HTML 5.0, column store databases, cloud computing, mobile apps, etc. This helps to
keep Power BI at the top and famous, as it is continuously equipped with the latest features.
Power BI Training
Master Your Craft
Lifetime LMS & Faculty Access
24/7 online expert support
Real-world & Project Based Learning
Now we will get into the power bi components in detail.
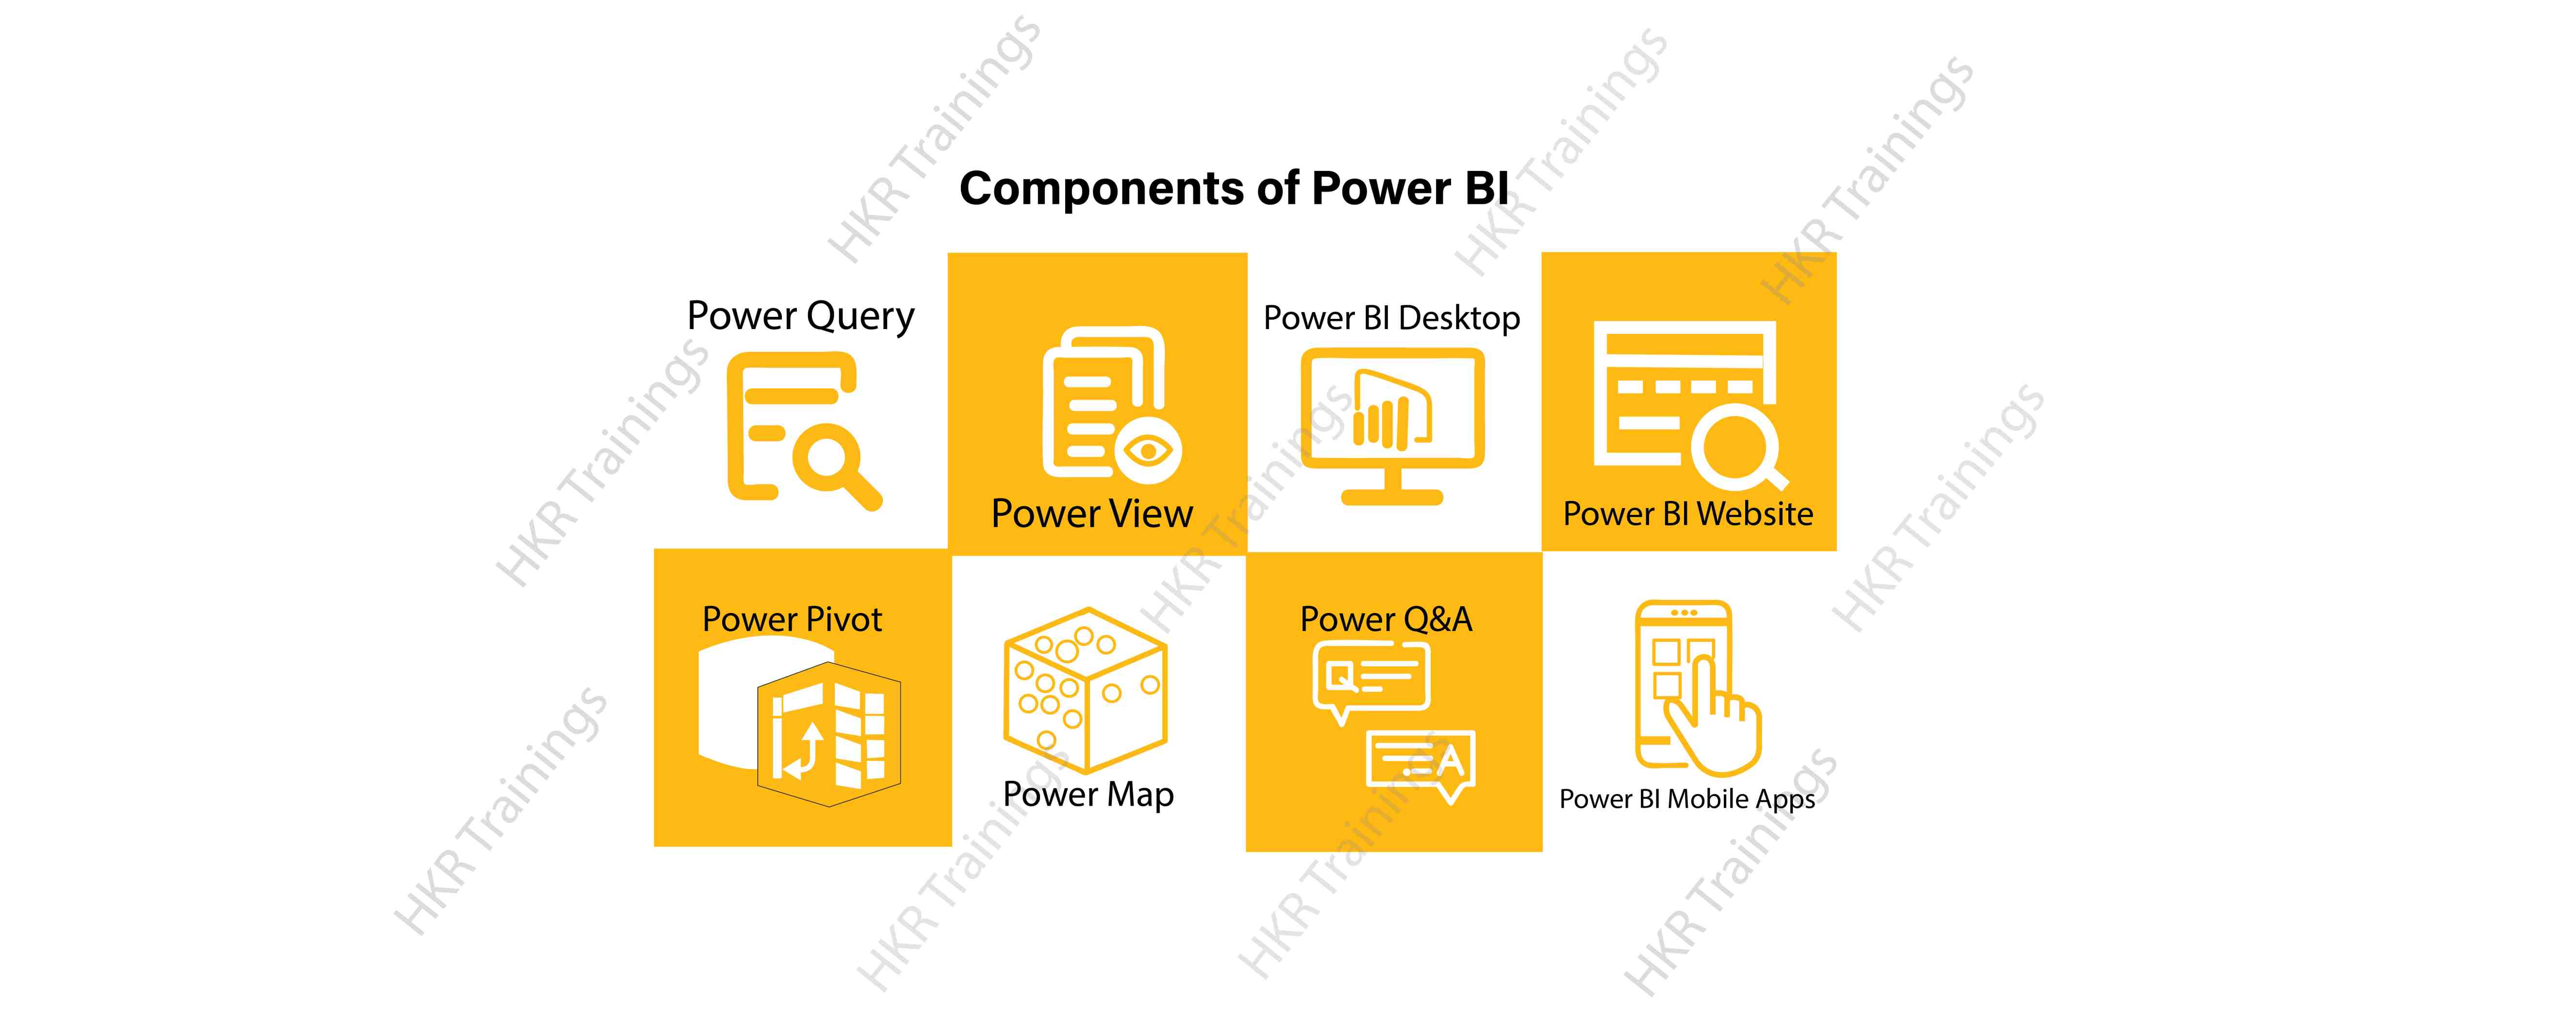
Power BI Components:
Here are the lists of power BI components. They are:
Power Query
Power Pivot
Power View
Power Map
Power Q&A
Power BI Desktop
Power BI Website
Power BI Mobile Apps
Now start discussing each and every component of power BI in detail.
Power Query is one of the most essential components of Power BI. This would be included in your Excel or could be used as a Power BI Desktop component. Using Power Query, you can uninstall data from multiple data sources and retrieve data from a wide variety of different databases, such as Oracle, SQL Server, MySQL, and other databases. You can also retrieve data from records such as text files, CSV files, etc.
Power BI provides you a powerful GUI so that you really can change and use the information you need, such as date and time changes, add columns, modify types and content, and a variety of options. It includes a small language, Power Query M Formula Language, as a code that is more powerful than a GUI.Power Query Formula Language in Power BI is highly secure and optimized for the development of highly highly scalable mashup queries accessible to Power BI Desktop and Power Query. It has several features that cannot be made available by a GUI.
Power Pivot:
Power Pivot is a data designing and information technology engine. It’s being used to model static and dynamic data. You can establish or generate relations between various tables in Power Pivot and quantify values that can be considered in Pivot tables. It provides a tremendous opportunity to build your design.The language used mostly by Power BI Pivot is Data Analysis Expression (DAX), a highly functional language.
Subscribe to our YouTube channel to get new updates..!
Power View:
Power View is a major aspect of Power BI data visualization. It is an immersive device that connects to data sources and collects metadata that can be used for data collection. There are a lot of image processing blueprints in the Power View list. With Power View, you could even process the data for each visualization element or for the entire report. Slicers can be used to make better dicing of the information.Power View reports are responsive; the user can illustrate some of the data or components in Power View to communicate directly with each other.
Power Map:
Power Map is used to display spatial information in 3D mode. As soon as the visual interface is rendered in 3D mode, it offers some other dimension. In Power Map, one characteristic can be assumed to be the length of a column in 3D and another attribute to be a heatmap view. The data can be illustrated on the basis of a geographical location. Geographical locations may be a country, state, city, or street address.In order to get the best view, Power Map works with Bing Maps related to geographical latitude or longitude or country, state, city or street address data.
Power Q&A:
Power BI Q&A is a common language engine for questionnaires about your data model. After you have assembled and updated your data model on the Power BI website, you or your customers can ask questions, if any, and find solutions to those questions. There are a few shortcut keys and hints for the development of your framework so that it can respond to questions in the most effective manner possible.
For data visualization, Power Q&A works with Power View so that users can ask any questions, such as the amount of clients per state, and the question is responded in the form of a map view with numbers shown as bubbles by Power Q&A.
Power BI Desktop is a continuous improvement of the Power BI suit. This is an embedded development tool for Power Query, Power Pivot and Power View. It allows you to build advanced queries, models, and reports. Power BI Desktop makes it easy to advance your BI skills and your data analytics experience.
Power BI Website:
Power BI solutions can be compiled on the Power BI website. You can generate dashboards for your news stories and share them with others, and you can also generate content directly on the Power BI website. With the Power BI website, you can conduct slice and dice online operations using a web browser, and you don’t even need any other tools.
Power BI Mobile Apps
Power BI Mobile Apps has three mobile operating system (OS) providers: Android, iOS, and Windows. These frameworks give you lots of an immersive view of Power BI reports and dashboards. You could even share them with your mobile app. A fraction of the documents can be displayed and a note can be written and shared with others.
In the above content, we had covered all the important components of power BI in detail. One can take a sound knowledge in the power BI technology by learning each and every components of the power BI architecture. However, the above stated information is strong enough to make you realize the importance of the power BI in corresponding to the data visualization, data analysis, etc.
To provide the best experiences, we use technologies like cookies to store and/or access device information. Consenting to these technologies will allow us to process data such as browsing behavior or unique IDs on this site. Not consenting or withdrawing consent, may adversely affect certain features and functions.
Functional
Always active
The technical storage or access is strictly necessary for the legitimate purpose of enabling the use of a specific service explicitly requested by the subscriber or user, or for the sole purpose of carrying out the transmission of a communication over an electronic communications network.
Preferences
The technical storage or access is necessary for the legitimate purpose of storing preferences that are not requested by the subscriber or user.
Statistics
The technical storage or access that is used exclusively for statistical purposes.The technical storage or access that is used exclusively for anonymous statistical purposes. Without a subpoena, voluntary compliance on the part of your Internet Service Provider, or additional records from a third party, information stored or retrieved for this purpose alone cannot usually be used to identify you.
Marketing
The technical storage or access is required to create user profiles to send advertising, or to track the user on a website or across several websites for similar marketing purposes.