3 Dividend Growth Stocks for Spring 2026


Dividend growth stocks can generate long-term wealth because of the compounding effect and price appreciation. At the start of spring 2026, we discuss three that typically benefit from the warming weather.

We highlight three equities that are market leaders in their categories and have solid long-term growth prospects. We discuss The Coca-Cola Company (KO), EPR Properties (EPR), and Molson Coors Beverage Company (TAP) for a dividend portfolio.

Dividend Growth Stocks for Spring 2026

The Coca-Cola Company (KO)

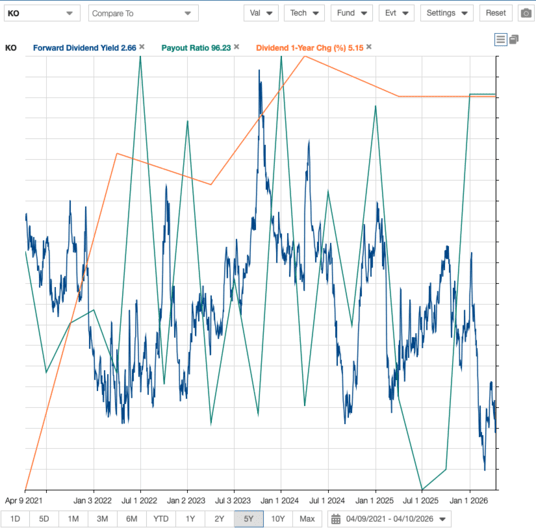
Coca-Cola is the world’s largest beverage company, as it owns or licenses more than 500 unique non-alcoholic brands. Since the company’s founding in 1886, it has spread to more than 200 countries worldwide. Its brands account for about 2 billion servings of beverages worldwide every day, producing about $48 billion in annual revenue. The company also has an exceptional 63-year dividend increase streak, making it a Dividend King

Coca-Cola posted fourth-quarter and full-year earnings on February 10th, 2026, and results were mixed. The company saw adjusted earnings per share of 58 cents, which was two cents ahead of estimates. Revenue was up 2.6% year-over-year to $11.8 billion. Organic revenue was up 5%, driven by a 4% gain in concentrate sales and 1% in price and mix. Concentrate sales were 3% better than unit case volume, which was driven by the timing of shipments and one additional selling day. 

Comparable operating margin expanded from 24% of revenue a year ago to 24.4%, which met consensus estimates. Gross margin rose by a similar amount. Free cash flow, adjusted for the Fairlife contingent payout, was $11.4 billion for the full year, which was about $600 million higher than in 2024.

The dividend payout ratio has been in the mid-70% range for the past few years, but is below that now with rising earnings. Dividend growth will remain a priority for management, and we see the payout as safe, with room to grow, particularly with generally improving free cash flow generation.

Related Articles Aboout Coca-Cola on Dividend Power

KO Dividend Metrics
Source: Stock Rover

EPR Properties (EPR)

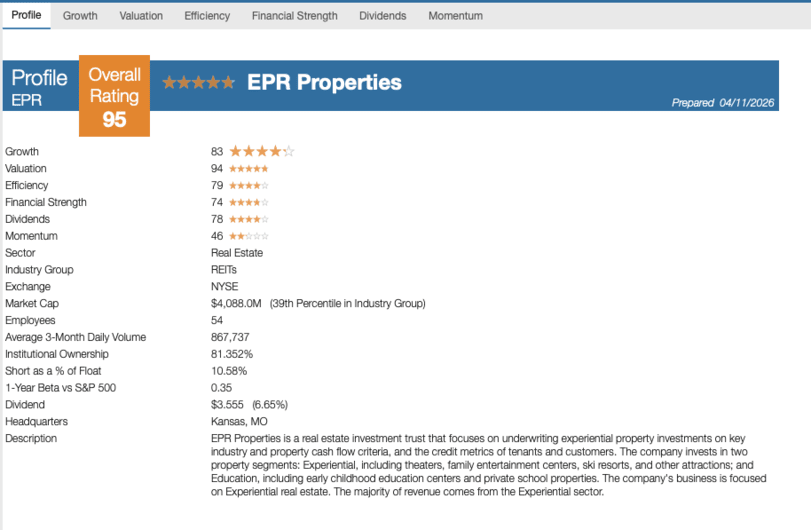
EPR Properties is a specialty real estate investment trust, or REIT, that invests in properties in specific market segments that require industry knowledge to operate effectively. It selects properties it believes have strong return potential in Entertainment, Recreation, and Education. Many of its properties benefit greatly from the start of spring and the warmer weather.

The portfolio includes about $7 billion in investments across 300+ locations in 44 states, including over 250 tenants. Total revenue should be in excess of $750 million this year. 

EPR posted fourth-quarter and full-year earnings on February 26th, 2026, and the results were good. FFO-per-share came to $1.30, which was as expected. Revenue was up 3.2% year-over-year to $183 million, beating estimates by $1 million. Rental revenue was up $8 million year-over-year. 

For the year, FFO came to $5.12 per share, up from $4.87 a year ago. Disposition proceeds were $35 million for the quarter and $168 million a year ago. The company also announced, separate from the earnings report, that it is acquiring seven regional amusement parks from Six Flags Entertainment (FUN) for a gross amount of $342 million. This would be the largest acquisition since 2017. 

EPR boosted its dividend by 5% to a new payout of $3.72 annually, its 5th consecutive year of increases, making it a Dividend Challenger. EPR currently yields 7.1%.

EPR Stock Rating
Source: Stock Rover

Molson Coors Beverage Company (TAP)

Molson Coors Beverage Company, previously Molson Coors Brewing Company, was founded in 1873. Since then, it has grown into one of the largest U.S. brewers, with a variety of brands including Coors Light, Molson Canadian, Carling, Blue Moon, Hop Valley, Leinenkugel’s, Crispin Cider, and Miller Lite through a joint venture called MillerCoors. As the warmer weather hits, TAP will benefit from higher consumption of its beverages.

The company has a significant presence outside the U.S. Its international markets include Canada, Europe, Latin America, Asia, and Africa. It is the fourth-largest beer company in the world. In January 2025, Molson purchased an 8.5% stake in Fevertree Drinks plc, which made it the 2nd largest shareholder, advancing its Beyond Beer and premiumization strategy by expanding into non-alcoholic drinks. 

On February 18th, 2026, the company announced a 2% increase to the quarterly dividend to $0.48 per share. After October 20th, 2025, Molson Coors eliminated 400 salaried positions through its restructuring program in its Americas business by the end of 2025, which accounted for roughly 9% of its Americas business workforce. 

Molson Coors reported fourth-quarter 2025 results for the period ending December 31st, 2025. For the quarter, the company generated net sales of $2.66 billion, a 2.7% decrease compared to Q4 2024. Net sales declined 5.0% in the Americas, but rose 6.1% in Europe, the Middle East and Africa, and Asia-Pacific. Adjusted EPS fell 6.9% year-over-year to $1.21. The company repurchased $648 million of its shares in 2025.

With several top brands, Molson Coors can pass higher costs on to consumers. The company is also aggressively cutting its headcount in its Americas business and costs in other parts of the business to offset raw material inflation. In addition, Molson Coors is investing in new product categories to generate growth.

TAP currently yields 3.9%.

Related Articles About Molson Coors on Dividend Power

TAP Dividend Yield
Source: Stock Rover

Related Articles on Dividend Power


Here are my recommendations:

Affiliates

  • Simply Investing Report & Analysis Platform or the Course can teach you how to invest in stocks. Try it free for 14 days. 


  • Free Dividend Kings Spreadsheet from Sure Dividend, complete with Buy/Hold/Sell recommendations, dividend histories, and much more. It is an excellent resource for DIY dividend growth investors and retirees.


  • Stock Rover is the leading investment research platform with all the fundamental metrics, screens, and analysis tools you need. Try it free for 14 days.


Receive a free e-book, “Become a Better Investor: 5 Fundamental Metrics to Know!” Join thousands of other readers !


*This post contains affiliate links meaning that I earn a commission for any purchases that you make at the Affiliates website through these links. This will not incur additional costs for you. Please read my disclosure for more information.


Prakash Kolli is the founder of the Dividend Power site. He is a self-taught investor, analyst, and writer on dividend growth stocks and financial independence. His writings can be found on Seeking Alpha, InvestorPlace, Business Insider, Nasdaq, TalkMarkets, ValueWalk, The Money Show, Forbes, Yahoo Finance, and leading financial sites. In addition, he is part of the Portfolio Insight and Sure Dividend teams. He was recently in the top 1.0% and 100 (73 out of over 13,450) financial bloggers, as tracked by TipRanks (an independent analyst tracking site) for his articles on Seeking Alpha.


Source link

Leave a Reply

Subscribe to Our Newsletter

Get our latest articles delivered straight to your inbox. No spam, we promise.

Recent Reviews


Power BI Datasets – Table of Content

What is Power BI?

Power BI is a set of software services, apps, and connectors that work together to turn disparate data sources into coherent, visually immersive, and interactive insights. Your data could be in the form of an Excel spreadsheet or a hybrid data warehouse that is both on-premises and cloud-based. Power BI makes it simple to connect to your data sources, visualize and uncover what matters, and share your findings with whomever you choose.

 Become a Power BI Certified professional by learning this HKR Power BI Training !

What are Datasets in Power BI?

A dataset is a data collection that you can connect to or import. Power BI allows you to connect to and import all kinds of datasets, allowing you to put everything together in one place. Dataflows can also be used for sourcing the data for Datasets. Workspaces are associated with datasets, and a single dataset can be used in multiple workspaces.
We have selected “My workspace” and then the “Datasets + dataflows” tab in the example below

Power BI workspace

Let us now look into the different types of Datasets in Power BI.

Types of Datasets

Datasets in Power BI are ready to report and visualize the source of data. There are five different types of datasets, each of which can be constructed in one of the following ways:

  • An existing data model will be connected that is not hosted in a Power BI capability.
  • Power BI Desktop file needs to be uploaded which includes a model.
  • Uploading a CSV (comma-separated values) file, or uploading an Excel workbook (Includes one or more Excel tables and/or a workbook data model).
  • Creating a push dataset using the Power BI service.
  • Creating streaming or dataset with hybrid streaming using the Power BI service.

Let us now explore different types of Datasets.

1) External-hosted models

Azure Analysis Services and SQL Server Analysis Services are the two types of externally hosted models. Installing the on-premises data gateway, whether on-premises or VM-hosted infrastructure-as-a-service (IaaS), is required to connect to a SQL Server Analysis Services model. A gateway isn’t required for Azure Analysis Services.

When there are existing model investments, such as those that form part of an enterprise data warehouse(EDW), connecting to Analysis Services makes sense. By utilizing the identity of the Power BI report user, Power BI can establish a live connection to Analysis Services, enforcing data permissions. Both tabular models and multidimensional (cubes) are supported by SQL Server Analysis Services. A live connection dataset sends queries to externally hosted models, as demonstrated in the accompanying 

External-hosted models

2) Power BI Desktop-developed models

A model can be created using Power BI Desktop, a client application for Power BI development. The model is essentially a tabular Analysis Services model. Models can be created by importing data from dataflows and blending it with data from external sources. While the characteristics of how modeling can be accomplished are outside the subject of this article, it’s crucial to note that Power BI Desktop supports three different types, or modes, of models. We are going to discuss the datasets in the coming sections.

Row-Level Security (RLS) can be used in externally hosted models and Power BI desktop models to restrict the amount of data that can be obtained for a certain user. Users in the Salespeople security group, for instance, can only see report data for the sales region(s) to which they’ve been assigned. Roles in RLS can be either static or dynamic. Static roles apply the same filters to all users allocated to the position, whereas dynamic roles filter by the report user.

3) Excel workbook models

The creation of a model is automatic when datasets are created from Excel workbooks or CSV files. To construct model tables, Excel tables, and CSV data are imported, and an Excel workbook data model is translated to produce a Power BI model. In every scenario, data from a file is imported into a model.

4) Push Dataset

A Power BI dataset that can only be created and populated using the Power BI API is known as a push dataset. However, the lack of a good user interface for creating a push dataset restricted its adoption to scenarios where a single table was inhabited with real-time data streaming.

5) Hybrid Streaming Dataset

Real-time streaming in Power BI allows you to stream data and update dashboards in real-time. Real-time data and visuals can be displayed and updated in any Power BI visual or dashboard. Factory sensors, social media sources, service usage metrics, and a variety of other time-sensitive data collectors or transmitters can all be used to collect and transmit streaming data.

Hybrid Streaming Dataset

Want to know more about Power BI,visit here Power BI Tutorial !

Power BI Training

  • Master Your Craft
  • Lifetime LMS & Faculty Access
  • 24/7 online expert support
  • Real-world & Project Based Learning

How to Create a Power BI Dataset?

Before discussing the steps of creation. It is necessary to know that there are three basic ways to retrieve data in Power BI Desktop that you will use to create your visualizations:

1) Live:

Here you will be connecting to a server that carries all the data. Although no data is sent, the model’s metadata is imported into Power BI Desktop. A query is transmitted to the server when you build visualizations, and it is then executed. The outcomes are then visualized and returned to Desktop. With SQL Server Analysis Services (SSAS) models, whether multidimensional or Tabular, live connections are commonly employed. Power BI Desktop behaves like any other thin client in this scenario, like Excel or Reporting Services (SSRS). It is not possible to make major modifications to the model, but you can add new measurements that will be available in that  .pbix file.

2) DirectQuery:

You can make more modifications to the model here than you can with a Live connection. The data is kept on the server, and queries are run on the server, just like in Live. The Power BI Desktop model, for instance, allows for the creation of relationships.

3) Import:

Power Query queries are used to import the data into a Power BI Desktop file (.pbix). The data is compressed highly so it’s feasible to load records in millions into a file on your system. A model, comparable to an SSAS Tabular model, is built behind the scenes. This is the most versatile mode, as it allows you to blend data from any source. However, all data must be loaded into your model, which can take a long time to refresh.

Now, let’s move to create the dataset. Below are the steps which make you comprehend the creation of the Power BI Dataset.

1) A dataset is connected to the .pbix file where it was created one by one. When you first launch PBI Desktop, click “Get Data” to create a new dataset.

Get Data

Alternatively, you can choose a source from the dropdown menu as shown below:

dropdown menu

2) Let’s assume we imported a few tables from the WideWorldImporters SQL Server sample database (The .pbix file can be downloaded here). The tables and their relationships are visible in the Model view:

.pbix file downloaded

3) You can view the actual data of one table at a time in the “Data view”.

Data view

4) You can create, view, and interact with visualizations built on top of the data and model in the “Report view”. 

Report view

 The dataset is made up of the data as well as the model view. Now, let’s move to the different modes of Dataset available in Power BI.  

[ Related Article : msbi ]

HKR Trainings Logo

Subscribe to our YouTube channel to get new updates..!

Dataset modes in the Power BI

These modes of Dataset in Power BI ascertain whether or not data is imported into the model or retained in the data source. The following are the three Dataset modes in Power BI:

  1. Import
  2. DirectQuery
  3. Composite
1) Import

The most popular mode for developing datasets is the import mode. Because of in-memory querying, this mode provides incredibly quick performance. Modelers can also benefit from design flexibility and support for certain Power BI service capabilities (Quick Insights, Q&A, etc.). It’s the default mode when developing a new Power BI Desktop solution because of these advantages.

It’s crucial to realize that all imported data is saved on disk. When the data is refreshed or queried, it should be fully loaded into the memory of Power BI. Import models can yield very rapid query results once they are in memory. It’s also crucial to note that there’s no such thing as a partially loaded Import model in memory. An Import model can also integrate data from any number of supported data source types. The following image illustrates it. 

Import model

2) DirectQuery

Import mode can be replaced by DirectQuery mode. Data is not imported into models created in DirectQuery mode. Instead, they are made up entirely of metadata that defines the model’s structure. If the model is queried, data is retrieved by using the native queries from the underlying data source.

DirectQuery Model

3) Composite

The composite mode can blend DirectQuery and Import modes, or integrate multiple data sources for DirectQuery. The storage mode for every model table can be configured for models created in Composite mode. Calculated tables (defined with DAX) can also be used in this mode.

Composite Model

Import and DirectQuery modes are used in composite models to give you the best of both modes. They can blend the high query performance of in-memory models with the capacity to access near real-time data from data sources when set properly.

Top 50 frequently asked Power BI Interview Questions

Power BI Training

Weekday / Weekend Batches

 Conclusion:
We have successfully learned that Power BI lets you connect various datasets for importing and bringing them all together in one place. In this blog, we explored the topics of Datasets in Power BI in a systematic flow by understanding Power BI, then Datasets in Power BI, different types of Datasets and models used for reporting and visualizing data, creating a Dataset for connecting files, and various modes of Datasets in Power BI.

Related Article:

  1. MSBI vs Power BI
  2. Looker vs Power BI
  3. KPI in Power BI
  4. DAX In Power BI
  5. Power BI Architecture
  6. Power BI Components
  7. Power BI Dashboard
  8. Power BI Data Modeling
  9. Power BI Documentation


Source link