
New Delhi [India], June 8: In India, the booming cities are grappling with the common problem of busy roads, overburdened junctions, and traffic management systems failing to keep pace with rising traffic volumes. Be it the metros or burgeoning cities across the country, traffic offences, be it jumping a signal, speeding, or lane indiscipline, are still adding to traffic bottlenecks and accidents. As over 30 crore vehicles are already registered in India, and metropolises have seen about 8–10% annual vehicle growth rates in ownership, traffic management is transitioning from human policing to smart digital enforcement systems.
In this emerging paradigm, technology is increasingly used by city governments for monitoring traffic behavior, issuing real-time violation detection, and carrying out automatic processing of violations and penalty payments. To this cause, one organization, Brihaspathi Technologies, has developed an integrated Traffic Enforcement Solution for a wide-scale deployment over urban road networks. This Traffic Enforcement Solution encompasses AI-enabled traffic monitoring, automated violation detection, evidence management, and integrated e-challan systems to function as a cohesive enforcement framework operating over a number of intersections and city corridors at the same time.
It is a fact that the government road safety figures indicate over 4.6 lakh road accidents happen each year in India, and over speeding itself contributes to over 65% of reported accidents. It is also a fact that enforcement officers frequently look after hundreds of intersections with a very small number of men and cannot be on constant lookout. Intelligent traffic systems are able to solve this problem, as any violation is automatically recorded digitally, and this would bring about uniformity in enforcement for a whole city.
Turning Cameras into Active Observers
Central to Brihaspathi’s Traffic Enforcement Solution is intelligent traffic monitoring. AI-enabled camera systems continually view vehicle flow across traffic lights and along traffic corridors. These cameras go beyond simply recording, processing the traffic flows dynamically, and immediately flagging anything abnormal.
It can also be used in conjunction with high-definition imaging and video analysis; the system will be capable of monitoring vehicle movement through the lanes, through signal adherence, and the behaviour of vehicles through more than one lane at the same time. This enables traffic authorities to monitor multiple intersections from one control centre, as opposed to having staff monitoring each individual intersection. In dense urban areas where an intersection may have 10,000–20,000 vehicle movements per hour, enforcement through personnel at each intersection would not be possible.
Identifying Violations Instantly
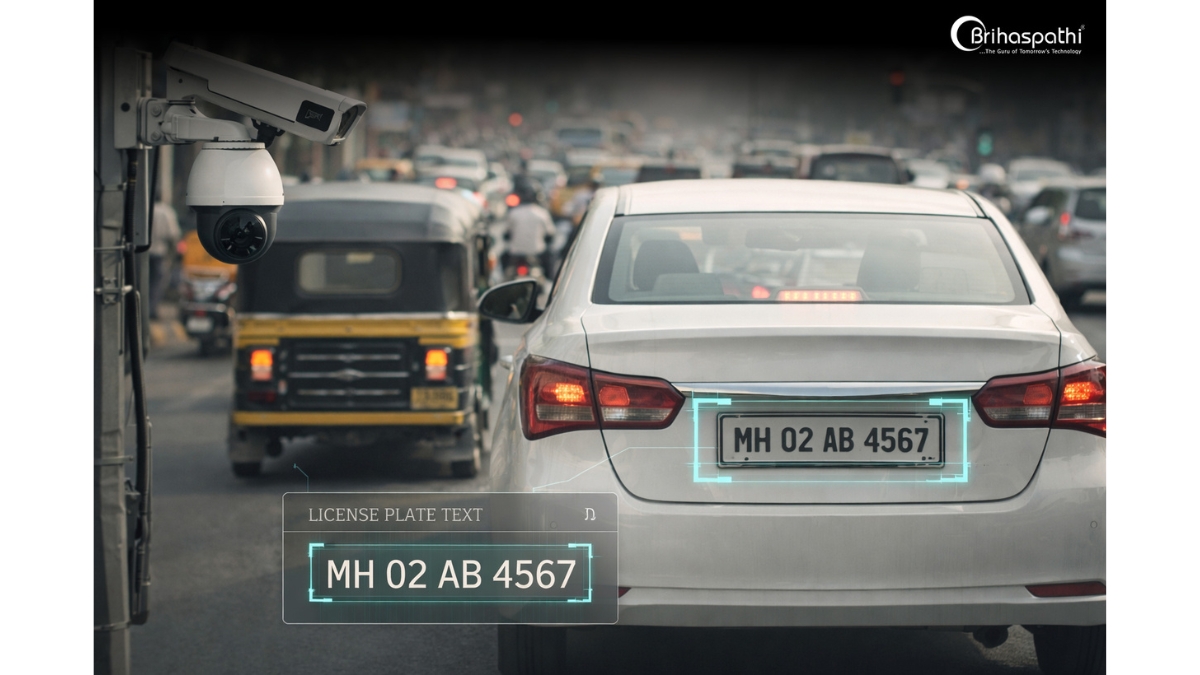
One of the crucial features of the platform is the use of Automatic Number Plate Recognition (ANPR). Cameras of high resolution take pictures of vehicle plates, which are then turned into a computer-based format (text) by use of optical character recognition. The data captured is immediately compared to registered vehicles; thus, vehicles committing offenses can be instantly detected.
In cities with millions of registered vehicles, ANPR technology represents the fundamental digital infrastructure for automated law enforcement. The technology is “always on”, detecting the identification of vehicles on all busy intersections, highways, and toll routes without the need for human assistance.
Monitoring High-Risk Intersections
In cities, the majority of traffic offences are related to signal jumping. The RLVD system developed by Brihaspathi monitors intersections for vehicles that jump stop lines when the lights are red.
Upon violation detection, cameras take images and a brief video clip, including the timestamped GPS information. This becomes part of the digital evidence recorded that generates the penalty. RLVD systems have been proven in numerous projects worldwide to decrease signal violations up to 40% over a period of time, due to awareness and persistent enforcement.
Addressing a Major Accident Factor
Speeding has remained one of the primary causes of road accidents. Brihaspathi employs a speed detection system, which is linked to a radar, to calculate the vehicle speed. The radar sensor tracks the vehicle beyond predefined speed limits and simultaneously captures and records the offense along with a photograph.
The system could be implemented on all highway stretches, arterial roads in cities, and accident black spots. In areas where the speed enforcement technology has been widely implemented, traffic departments have confirmed reduced instances of high-speed violations.
Building a Reliable Enforcement Archive
All detected infringements are recorded on the system as visual evidence and placed into a video evidence management system where images, video footage, times, and infringement data are held in an orderly manner and can easily be accessed when needed.
Through digitalizing the evidence management system, the traffic department is breaking away from scattered filing rooms and manual evidence handling. This would create a transparent enforcement process where violation data are accessible via authorized devices.

Understanding Traffic Behaviour
In addition to logging instances of violation, Brihaspathi’s platform features AI-powered violation analytics, which processes huge amounts of traffic data in order to recognize behavioral patterns. By analyzing patterns at individual intersections, enforcement agencies are able to predict intersections prone to frequent signal violations, the time period within which most speed offenses are committed, or persistent points of traffic congestion.
All this is useful for the city planners and enforcement personnel to formulate strategies for optimizing signal timing, designing road networks, and directing the enforcement efforts more effectively.
Automated e-Challan Generation and Smart Notification Systems
The digital e-challan containing the vehicle’s identification information, the offense type, photographic evidence, and location is generated and electronically forwarded by the platform once the violation is confirmed. The owner of the vehicle is informed about the same using authorized governmental channels.
The system is also enabled for smart notifications. The drivers can be informed through the SMS or other messaging services of violations and payment of fines. This enables paperless processing and shortens processing time for fines.
Integrated with Government Databases and Enforcement Platforms
The Traffic Enforcement Solution integrates into existing government infrastructure, including the vehicle registration database, the traffic police database, and the digital payment gateways for challan payment. Linking the enforcement process with the official database enables enforcement agencies to carry out penalties in the administrative procedures already existing.
This interoperability makes the system suitable for large-scale government deployments, where technology must work seamlessly within regulatory infrastructure.
Real-Time Traffic Analytics and Multi-Location Monitoring
Control rooms usually supervise hundreds of intersections across the entire city. Brihaspathi has developed traffic analytics dashboards that show the status (real-time data on traffic density, violation frequency, and camera health) of hundreds of intersections from a centralized location.
An operator can view traffic behavior throughout city zones from one display, reducing the response time in traffic incidents like congestion, accidents, or strange circumstances. Multi-location monitoring can be particularly useful to cities with large-scale traffic controls (hundreds of traffic lights).
Designed for Citywide Deployment and Market Impact
In many modern cases, traffic enforcement systems have been planned for citywide coverage, and this infrastructure can grow with expanding cities. Brihaspathi’s architecture enables gradual expansion from single intersections to entire urban traffic networks without interrupting current infrastructure.
Globally, the intelligent traffic management market is expected to reach above $60 billion in 2030 on account of rapid urbanization and the adoption of smart cities. India has become one of the fastest-growing markets for AI-based traffic monitoring technologies due to its increasing focus on smart mobility and digital governance.
In addition to helping record and document violations, as cities more widely implement automated enforcement, increased digital enforcement may encourage drivers to slow down, lower accident rates, and supply city engineers with data required for designing safer roads.
Technology Supporting Safer Roads
Commenting on the vision behind the platform, Chairman and Managing Director Rajasekhar Papolu said:
“With the volume of traffic increasing year after year, manual surveillance can never be enough in urban transportation networks. Our ambition is to develop intelligent systems in which technology is watching around-the-clock, accurately recording offenses and enabling operational transparency for effective citywide traffic control for law enforcement agencies.”
Shaping the Future of Urban Mobility
With the growth of Indian cities and the increasing sophistication of travel systems, intelligent traffic enforcement systems will soon become an integral part of urban infrastructure. Solutions that integrate monitoring, analysis, and automatic enforcement would help officials in optimizing road networks and also induce an atmosphere of lawfulness among drivers.
The Brihaspathi Technologies, with its Traffic Enforcement Solution, is helping pave the way for the time when each signal, each lane, each intersection will become a part of the digitally monitored traffic network, facilitating safer traffic and wiser urban movement.
Visit our website to discover more, and for the company’s vision & leadership, connect with our CMD on LinkedIn
If you object to the content of this press release, please notify us at pr.error.rectification@gmail.com. We will respond and rectify the situation within 24 hours.

Stephan is the sports journalist for the Maple Grove Report.