Will a jet fuel shortage really snarl Europe flights this summer?


It’s been a nerve-wracking few days for travelers with upcoming trips to Europe, including those planning to make the transatlantic trek for the upcoming summer travel season.

Concerns over a growing shortage of jet fuel on the continent have raised fears about potential flight cancellations if things don’t improve.

This week, European Union leaders said that as of now, there’s no immediate cause for alarm, and airports are seeing “no evidence of actual shortages” yet.

“Nonetheless, we need to be prepared,” Apostolos Tzitzikostas, the EU commissioner for sustainable transport and tourism, said Tuesday at a news conference.

Travelers should be, too.

Which airports could be affected by the European jet fuel shortage?

Fears over airports potentially running out of jet fuel spiked earlier this month, when the head of the International Energy Agency warned Europe had “maybe six weeks or so” of jet fuel left.

Those concerns, of course, came amid a global oil crisis triggered by the conflict in the Middle East — the same oil crunch that has driven up gas prices and triggered major airfare increases worldwide.

Airline passengers at Paris-Charles de Gaulle Airport (CDG) in Paris. NATHAN LAINE/BLOOMBERG/GETTY IMAGES

So far, we haven’t seen mass flight cancellations tied to the shortage of jet fuel in Europe.

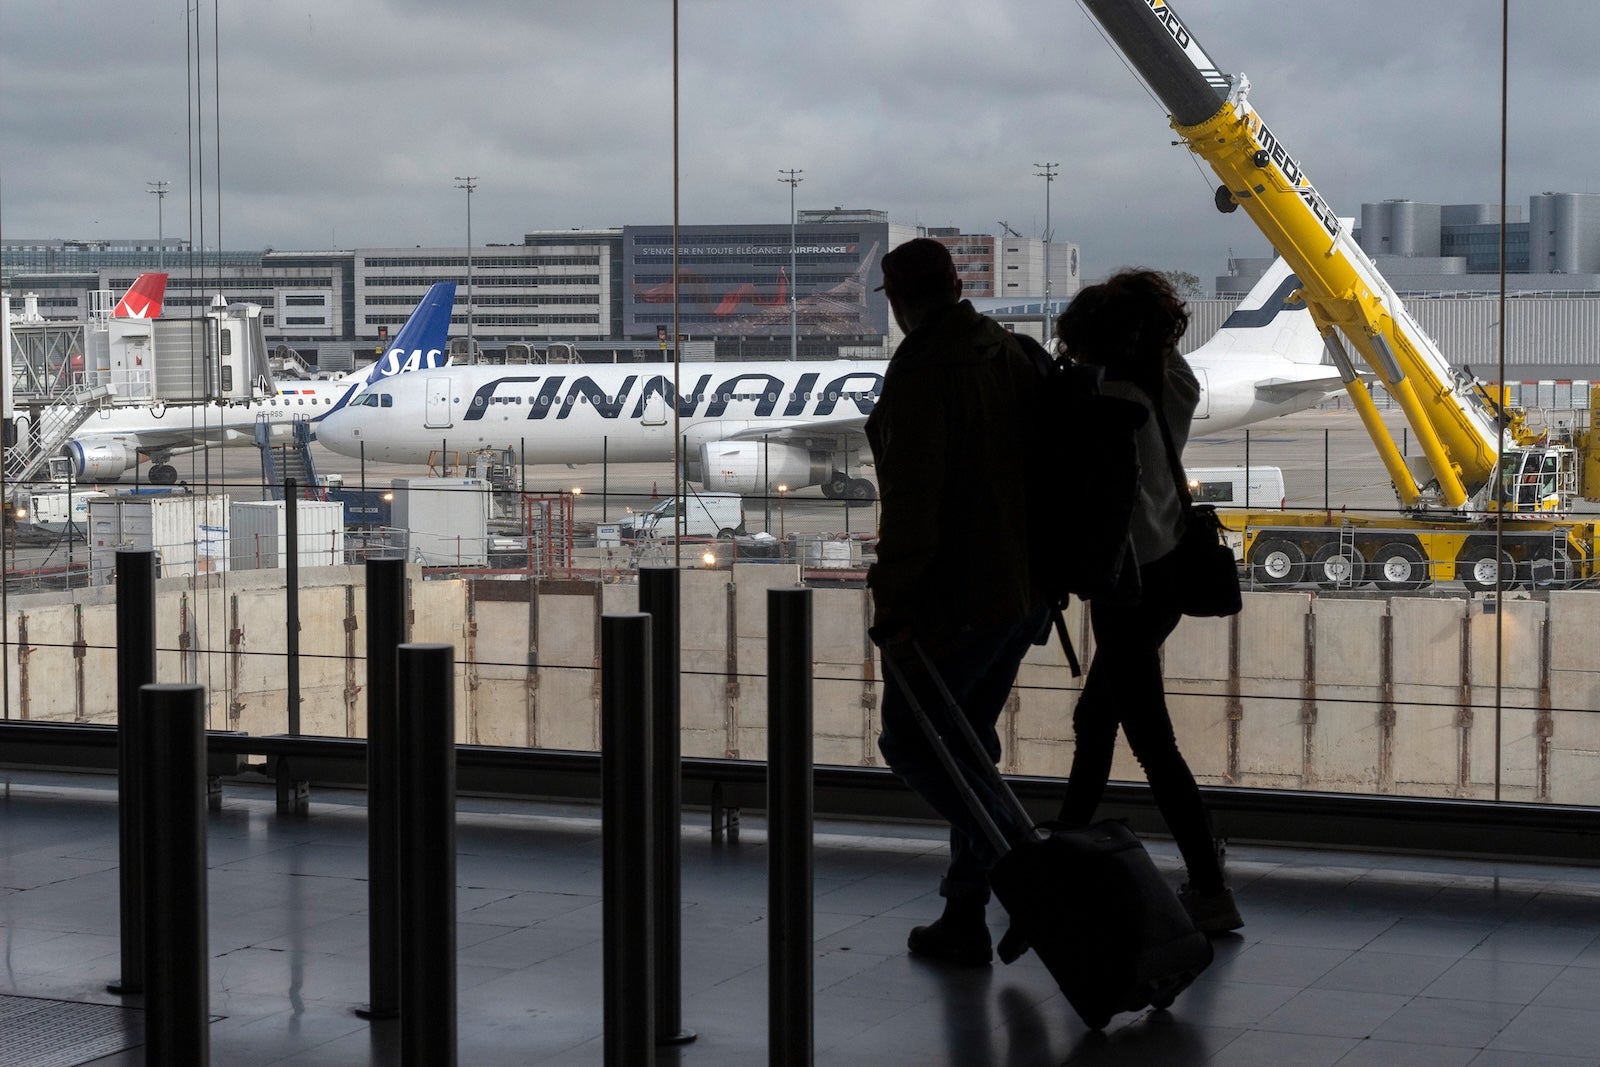
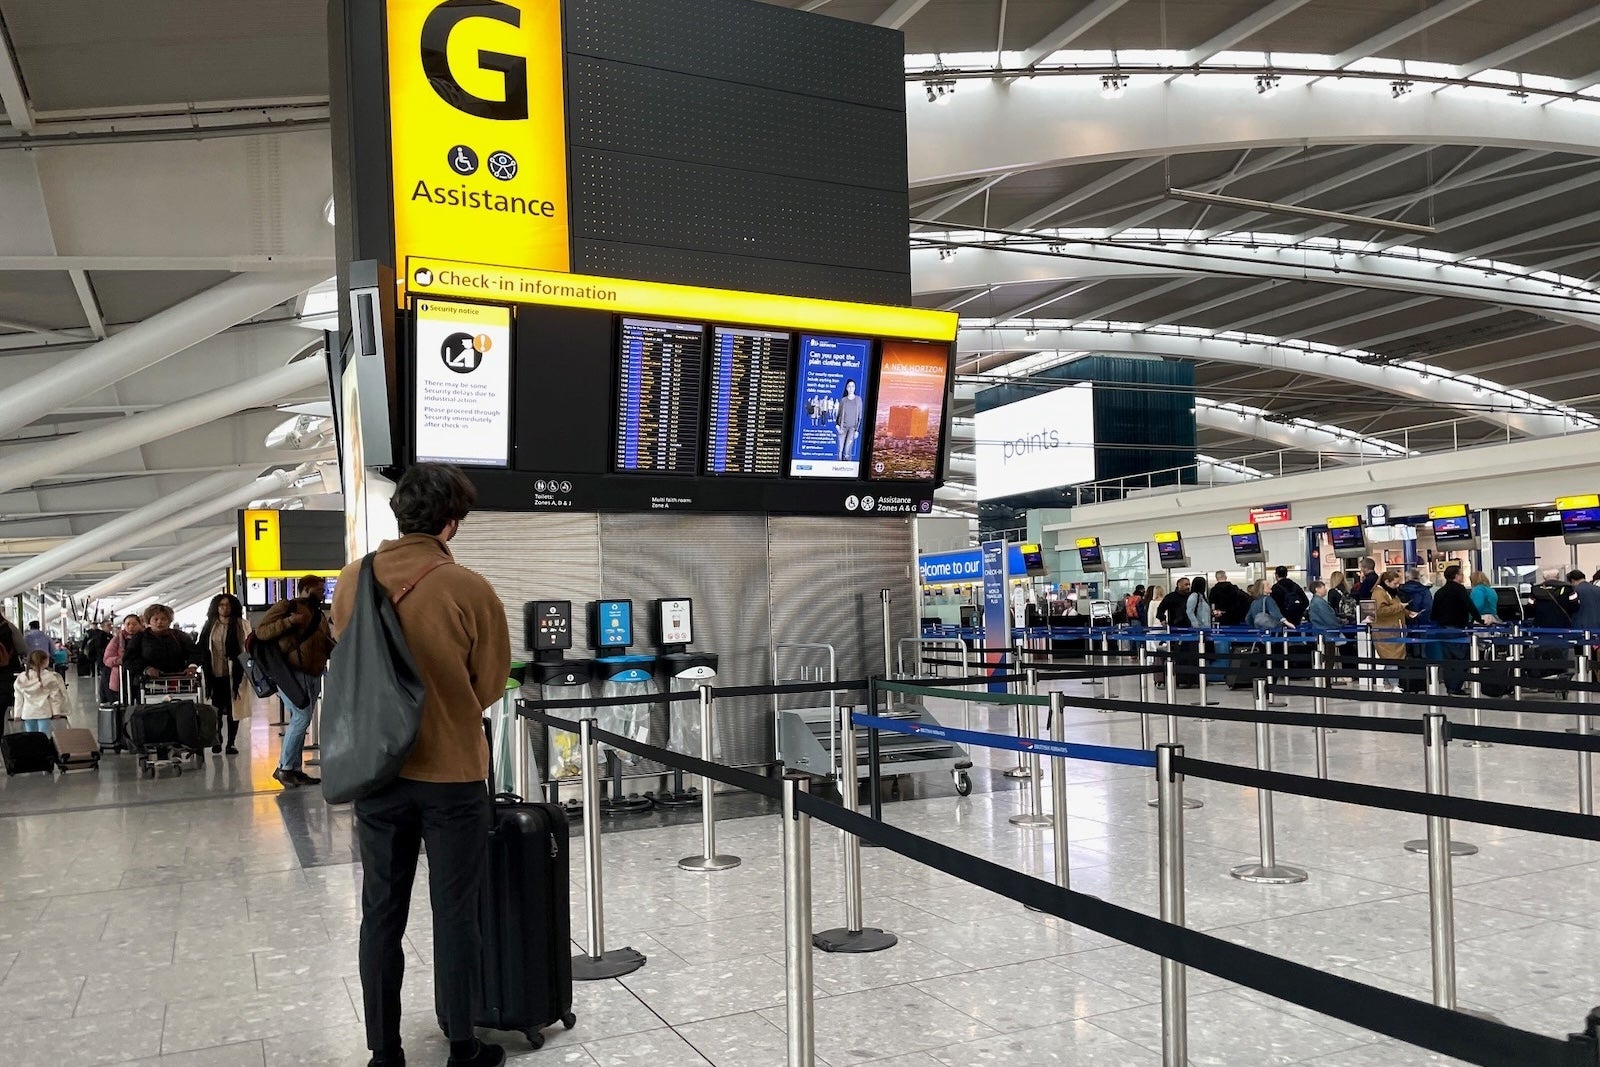
TPG spoke with experts who predicted flight cutbacks (if they do happen) would likely begin at smaller airports in the region as opposed to major international hubs like Heathrow Airport (LHR) or Paris-Charles de Gaulle Airport (CDG).

Reward your inbox with the TPG Daily newsletter

Join over 700,000 readers for breaking news, in-depth guides and exclusive deals from TPG’s experts

“My bet is that fuel shortages would start at secondary and tertiary airports that don’t have fuel farms while the major hubs would be insulated for a bit longer,” Mike Stengel, principle at the aerospace consultancy AeroDynamic Advisory, said.

British Airways Embraer 190 at London City Airport (LCY). SEAN CUDAHY/THE POINTS GUY

For that reason, I’d be less worried about that transoceanic flight on a big twin-aisle plane than I would be about that short-haul flight from one off-the-beaten-path European city to another.

Case in point: I just booked a June trip to Europe. My concern about the Aer Lingus flight across the Atlantic from Washington, D.C., to Dublin is low. I’ll be keeping a closer eye on the short jaunt from Split, Croatia, to Copenhagen.

Tips for navigating European travel

If you’re planning to “hop around” Europe in the coming months, I’d build some buffer time into your itinerary and keep an eye out for backup flight options. Or, you can opt to take the train instead.

Also, consider booking flexible hotel stays (that aren’t prepaid) to avoid losing your deposit if your itinerary gets off track — though you’ll still have to watch for reservations with fees if you cancel at the last minute. You can also typically accomplish the most flexibile rules by booking your reservations with points.

Backup plans in motion

Should the global oil shortfall not improve in soon, EU leaders said they’d plan to tap the region’s emergency jet fuel reserves.

Tzitzikostas said the EU was already working on securing an “alternative jet fuel supply” for Europe, including from the U.S.

Terminal 5 at London’s Heathrow Airport (LHR). JORDAN PETTITT/PA IMAGES/GETTY IMAGES

“Airlines may also have some tools at their disposal like tankering fuel — where they would carry more fuel than needed for a given flight — so they can transport it to their hubs in an effort to relieve supply constraints,” Stengel told TPG. Although, he was also quick to point out: “It’s a fluid situation, and we’ll have to see how things play out in the coming days and weeks.”

Have flight cancellations begun in Europe?

Airlines have already begun cutting flights, to be sure. But those cancellations have largely been tied to the sky-high price of jet fuel.

Most notably, Lufthansa Group announced more than 20,000 cancellations between now and October across its key hubs in Frankfurt, Munich, Zurich, Vienna, Brussels and Rome.

That included shuttering its CityLine subsidiary, as TPG previously reported. Lufthansa Group is the parent company of a host of European airline brands, including Lufthansa, Swiss, Brussels Airlines, Austrian Airlines and ITA.

Lufthansa CityLine aircraft parked at Munich Airport (MUC). SVEN HOPPE/PICTURE ALLIANCE/GETTY IMAGES

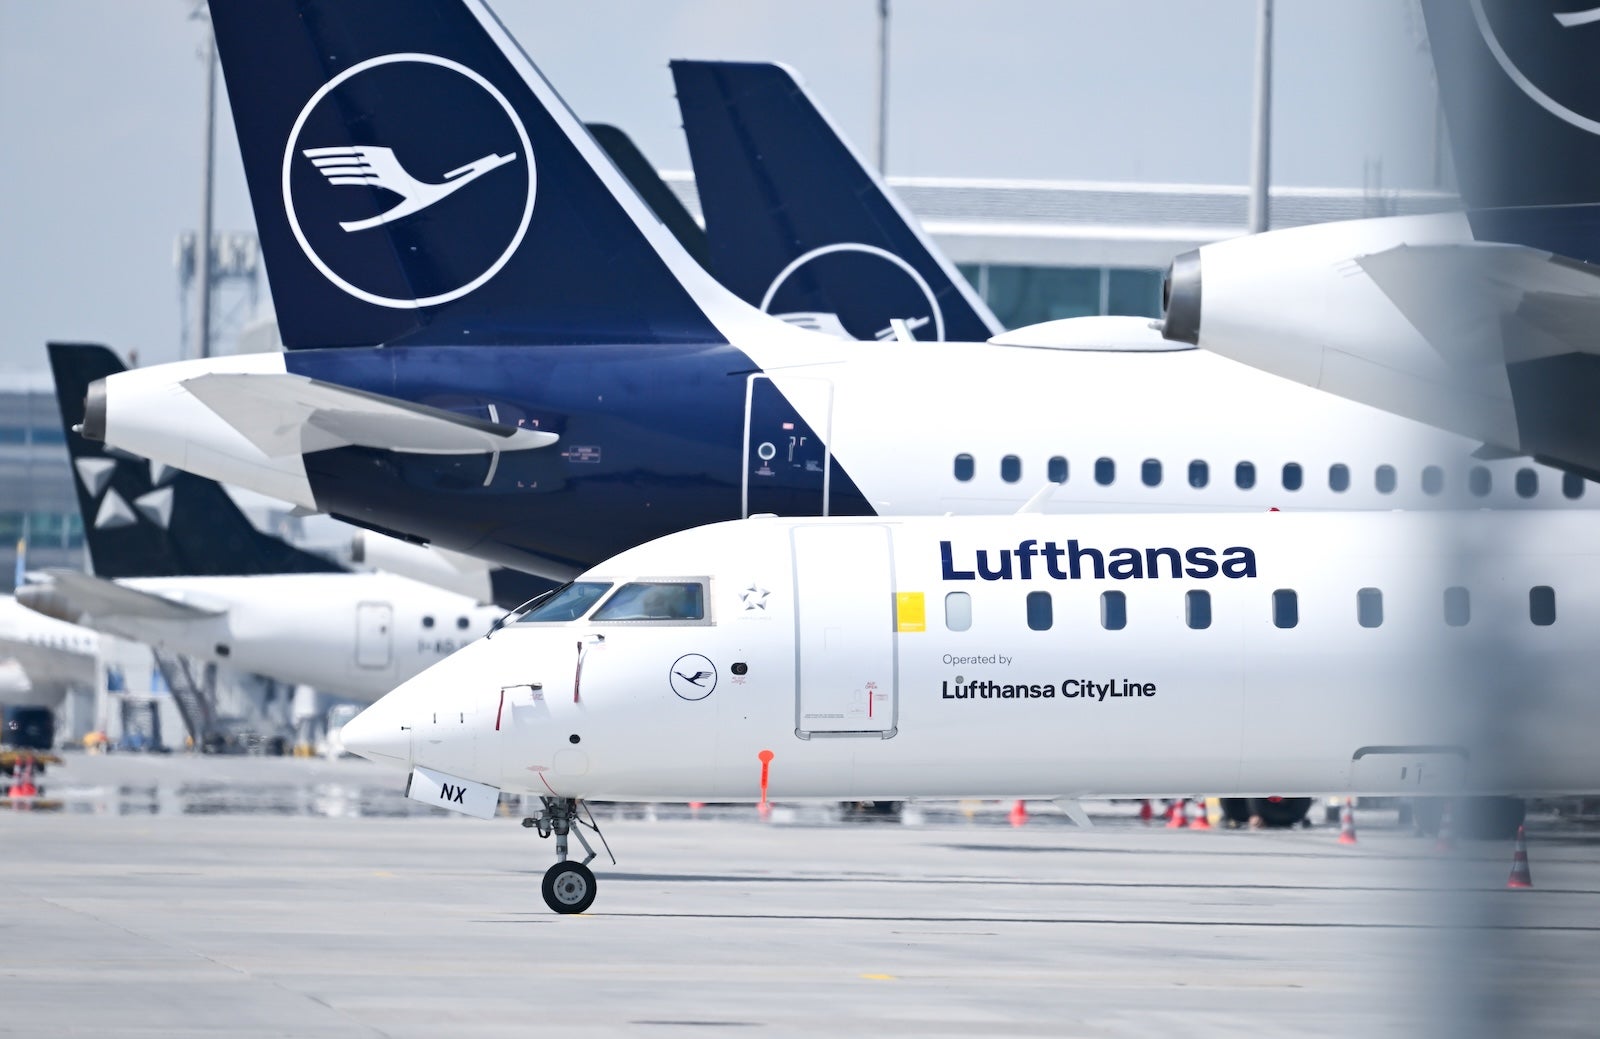
Those cuts to “unprofitable routes” were primarily finance-driven, though the company did point out those cancellations would save 40,000 metric tons (about 10.5 million gallons) of jet fuel.

Cancellations through May 31 have already been announced, with the rest to be revealed by the end of this month.

Bottom line

Unfortunately, we may see more flights affected if the oil supply chain bottleneck doesn’t ease soon.

You can read more of our tips about navigating European travel during this crisis here, including our thoughts on passenger rights and travel insurance.

Related reading:


Source link

Leave a Reply

Subscribe to Our Newsletter

Get our latest articles delivered straight to your inbox. No spam, we promise.

Recent Reviews


EDA in Machine Learning – Table of Content

What is Exploratory Data Analysis (EDA)?

A method for summarizing data, identifying patterns and relationships, and detecting outliers is exploratory data analysis. This type of data analysis is most often used when the data set is large or complex, and it can help with data comprehension. There are numerous techniques for exploratory data analysis, but the most common include visual methods like plotting data on a graph and statistical methods like calculating summary statistics. Exploratory data analysis is an important step in data analysis that can be used on both qualitative and quantitative data.

   Want to Become a Master in Machine Learning? Then visit here to Learn Machine Learning Training

Steps Involved in Exploratory Data Analysis

Let us look into the various steps involved in Exploratory Data Analysis

Identifying the Data Source(s) and Data Collection

To understand the data, identify the data source(s) and the data collection process first. It is possible to use primary or secondary data sources. If the data comes from a primary source, it was gathered by the study’s researcher(s). If the data is from a secondary source, it was collected by someone other than the researcher(s) and made available for use.

Following the identification of the data source(s), the next step is to understand the data collection procedure. Understanding how the data was gathered and what biases, if any, may exist in the data is part of this. Researchers can interpret data more accurately if they understand the data collection process.

Machine Learning

Machine learning is a rapidly expanding data science field with enormous potential in exploratory data analysis (EDA). EDA has traditionally been performed manually by inspecting data sets for patterns and trends. Machine learning, on the other hand, enables us to automate this process and have computers do the work for us. There are several machine learning algorithms available for EDA, each with its own set of benefits and drawbacks. There are several popular machine learning algorithms and how they can be used to improve your EDA.

Exploratory Data Analysis(EDA)       

 Exploratory Data Analysis is a critical component involved while working with data. Exploratory data analysis is used to comprehensively understand the data and discover all of its characteristics, typically by employing visual techniques. This makes it possible for you to understand your data more thoroughly and find interesting patterns in it.

1. Load .csv files

 A CSV (comma-separated values) file is a type of text file that saves data in a table-structured format using a specific format.

 2. Dataset Information

You must first understand your dataset in order to perform an Exploratory Data Analysis (EDA). This includes understanding the dataset’s data type, what each column represents, and any other relevant information. This understanding is critical for properly performing an EDA because it will help you know what to look for and how to analyze the data.

 3. Data Cleaning/Wrangling

 To perform effective Exploratory Data Analysis (EDA), your data must first be cleaned and wrangled. The process of transforming raw data into a format suitable for analysis is known as data wrangling. This usually involves removing invalid or irrelevant data, dealing with missing values, and standardizing data types. You can begin EDA once your data is in good shape.

 4.Group by names

 One of the first steps in Exploratory Data Analysis is to group data by one or more variables (EDA). This helps us understand the relationships between the variables and identify any trends or patterns. There are several approaches to data grouping, but one of the most common is to group by name. The groupby() function in Pandas can be used to accomplish this. To group by name, we must first create a dataframe with columns for each variable. For this example, we’ll use the dataframe:

 | name | age | gender |

|——|—–|——–|

| John | 20 | Male | 

| Jane | 21 | Female | 

| Dave | 22 | Male | 

| Emily | 23 | Female |

 5.Summary of Statistics

 Your sample data is summarized and informed by summary statistics. It gives details about the values in your data set. Determine where the mean is and whether or not your data is skewed.

Machine Learning Training

Master Your Craft

Lifetime LMS & Faculty Access

24/7 online expert support

Real-world & Project Based Learning

 6 Dealing with Missing Values

 Missing data are values or variables that are not stored (or are not present) in the given dataset. Certain values may be missing from the data for a variety of reasons. The causes of missing data in a dataset influence how missing data is handled. As a result, it is critical to understand why the data may be missing.

 7.Skewness and kurtosis 

Skewness is a measure of the asymmetry of a distribution. Kurtosis is a summary statistic that conveys information about a distribution’s tails (the smallest and largest values). When graphical methods cannot be used to communicate data distribution information, both quantities can be used.

 8.Categorical variable Move

 A categorical variable (also known as a qualitative variable) in statistics is a variable with a limited (and usually fixed) number of possible values that assigns each individual or other unit of observation to a specific group or nominal category based on some qualitative property

9.Create Dummy Variables

 Dummy variables are used in statistical modeling to represent categorical variables. A categorical variable has only one of a few possible values, such as gender, race, or political affiliation. Dummy variables are frequently used in regression analysis to represent variables that are not linearly related to the dependent variable. Creating dummy variables is a common data preparation step in exploratory data analysis. Simply create a new variable with a value of 1 if the original variable is equal to a certain value and a value of 0 otherwise to create a dummy variable.

10.Removing Columns 

During the early stages of Exploratory Data Analysis, it is frequently advantageous to remove columns from your dataset (EDA). This can be done for a number of reasons, including shrinking your dataset or removing columns that are no longer relevant to your analysis. There are several methods for removing columns from a dataset, and which one you use depends on your specific situation. This article will demonstrate three methods for removing columns from a dataset: drop(), column indexes(), and remove columns (). Once you’ve learned how to remove columns from a dataset, you’ll be able to easily manipulate your data.

HKR Trainings Logo

Subscribe to our YouTube channel to get new updates..!

11.Univariate Analysis

You examine data from only one variable in Univariate Analysis. In your dataset, a variable refers to a single feature/column. This can be accomplished visually or non-visually by locating specific numerical values in the data. Visual techniques include:

Histograms are bar plots that display the frequency of data using rectangle bars.

Box plots: Information is represented by boxes in this plot.

12. Bivariate Analysis

Bivariate Analysis compares two variables. This enables you to see how one feature affects another. It is accomplished through the use of scatter plots, which depict individual data points, or correlation matrices, which depict the correlation in hues. Boxplots are another possibility.

13.Multivariate Analysis

The term “multi” refers to “many,” and “variate” refers to “variable.” Multivariate analysis is a statistical procedure for analyzing data that contains more than two variables. This method can also be used to investigate the relationship between dependent and independent variables to perform exploratory Data Analysis.

14.Distributions of the variables/features

Understanding the distributions of the variables/features in your dataset is critical for exploratory data analysis. This will help you understand the data better and identify any outliers or unusual behavior. The histogram is a popular method for visualizing distributions. A histogram shows how frequently each value appears in a dataset. It’s a handy tool for determining the distribution of a numerical variable.

15.Correlation

A correlation matrix is used to investigate the relationship between various variables. The correlation coefficient determines the degree to which two variables are linked. The following table depicts the relationship between salary, age, and balance. Correlation describes the relationship between two variables. This allows us to see how changes in one variable affect changes in the others.

Machine Learning Training

Weekday / Weekend Batches

Conclusion

Machine learning is a rapidly growing field with a wide range of practical applications. Before developing effective machine learning models, it is critical to first understand the data. Exploratory data analysis (EDA) is an important step in the machine learning process. EDA helps us understand the data better and identify patterns and trends that may be hidden within it.EDA can also be used to identify potential data issues. Overall, EDA is an important part of the machine learning process. By better understanding the data, we can build better machine learning models that are more likely to produce accurate results.


Related Course:

Rapidminer Training


Source link