EDA in Machine Learning – Table of Content
What is Exploratory Data Analysis (EDA)?
A method for summarizing data, identifying patterns and relationships, and detecting outliers is exploratory data analysis. This type of data analysis is most often used when the data set is large or complex, and it can help with data comprehension. There are numerous techniques for exploratory data analysis, but the most common include visual methods like plotting data on a graph and statistical methods like calculating summary statistics. Exploratory data analysis is an important step in data analysis that can be used on both qualitative and quantitative data.
Want to Become a Master in Machine Learning? Then visit here to Learn Machine Learning Training
Steps Involved in Exploratory Data Analysis
Let us look into the various steps involved in Exploratory Data Analysis
Identifying the Data Source(s) and Data Collection
To understand the data, identify the data source(s) and the data collection process first. It is possible to use primary or secondary data sources. If the data comes from a primary source, it was gathered by the study’s researcher(s). If the data is from a secondary source, it was collected by someone other than the researcher(s) and made available for use.
Following the identification of the data source(s), the next step is to understand the data collection procedure. Understanding how the data was gathered and what biases, if any, may exist in the data is part of this. Researchers can interpret data more accurately if they understand the data collection process.
Machine Learning
Machine learning is a rapidly expanding data science field with enormous potential in exploratory data analysis (EDA). EDA has traditionally been performed manually by inspecting data sets for patterns and trends. Machine learning, on the other hand, enables us to automate this process and have computers do the work for us. There are several machine learning algorithms available for EDA, each with its own set of benefits and drawbacks. There are several popular machine learning algorithms and how they can be used to improve your EDA.
Exploratory Data Analysis(EDA)
Exploratory Data Analysis is a critical component involved while working with data. Exploratory data analysis is used to comprehensively understand the data and discover all of its characteristics, typically by employing visual techniques. This makes it possible for you to understand your data more thoroughly and find interesting patterns in it.
1. Load .csv files
A CSV (comma-separated values) file is a type of text file that saves data in a table-structured format using a specific format.
2. Dataset Information
You must first understand your dataset in order to perform an Exploratory Data Analysis (EDA). This includes understanding the dataset’s data type, what each column represents, and any other relevant information. This understanding is critical for properly performing an EDA because it will help you know what to look for and how to analyze the data.
3. Data Cleaning/Wrangling
To perform effective Exploratory Data Analysis (EDA), your data must first be cleaned and wrangled. The process of transforming raw data into a format suitable for analysis is known as data wrangling. This usually involves removing invalid or irrelevant data, dealing with missing values, and standardizing data types. You can begin EDA once your data is in good shape.
4.Group by names
One of the first steps in Exploratory Data Analysis is to group data by one or more variables (EDA). This helps us understand the relationships between the variables and identify any trends or patterns. There are several approaches to data grouping, but one of the most common is to group by name. The groupby() function in Pandas can be used to accomplish this. To group by name, we must first create a dataframe with columns for each variable. For this example, we’ll use the dataframe:
| name | age | gender |
|——|—–|——–|
| John | 20 | Male |
| Jane | 21 | Female |
| Dave | 22 | Male |
| Emily | 23 | Female |
5.Summary of Statistics
Your sample data is summarized and informed by summary statistics. It gives details about the values in your data set. Determine where the mean is and whether or not your data is skewed.

Machine Learning Training
Master Your Craft
Lifetime LMS & Faculty Access
24/7 online expert support
Real-world & Project Based Learning
6 Dealing with Missing Values
Missing data are values or variables that are not stored (or are not present) in the given dataset. Certain values may be missing from the data for a variety of reasons. The causes of missing data in a dataset influence how missing data is handled. As a result, it is critical to understand why the data may be missing.
7.Skewness and kurtosis
Skewness is a measure of the asymmetry of a distribution. Kurtosis is a summary statistic that conveys information about a distribution’s tails (the smallest and largest values). When graphical methods cannot be used to communicate data distribution information, both quantities can be used.
8.Categorical variable Move
A categorical variable (also known as a qualitative variable) in statistics is a variable with a limited (and usually fixed) number of possible values that assigns each individual or other unit of observation to a specific group or nominal category based on some qualitative property
9.Create Dummy Variables
Dummy variables are used in statistical modeling to represent categorical variables. A categorical variable has only one of a few possible values, such as gender, race, or political affiliation. Dummy variables are frequently used in regression analysis to represent variables that are not linearly related to the dependent variable. Creating dummy variables is a common data preparation step in exploratory data analysis. Simply create a new variable with a value of 1 if the original variable is equal to a certain value and a value of 0 otherwise to create a dummy variable.
10.Removing Columns
During the early stages of Exploratory Data Analysis, it is frequently advantageous to remove columns from your dataset (EDA). This can be done for a number of reasons, including shrinking your dataset or removing columns that are no longer relevant to your analysis. There are several methods for removing columns from a dataset, and which one you use depends on your specific situation. This article will demonstrate three methods for removing columns from a dataset: drop(), column indexes(), and remove columns (). Once you’ve learned how to remove columns from a dataset, you’ll be able to easily manipulate your data.
Subscribe to our YouTube channel to get new updates..!
11.Univariate Analysis
You examine data from only one variable in Univariate Analysis. In your dataset, a variable refers to a single feature/column. This can be accomplished visually or non-visually by locating specific numerical values in the data. Visual techniques include:
Histograms are bar plots that display the frequency of data using rectangle bars.
Box plots: Information is represented by boxes in this plot.
12. Bivariate Analysis
Bivariate Analysis compares two variables. This enables you to see how one feature affects another. It is accomplished through the use of scatter plots, which depict individual data points, or correlation matrices, which depict the correlation in hues. Boxplots are another possibility.
13.Multivariate Analysis
The term “multi” refers to “many,” and “variate” refers to “variable.” Multivariate analysis is a statistical procedure for analyzing data that contains more than two variables. This method can also be used to investigate the relationship between dependent and independent variables to perform exploratory Data Analysis.
14.Distributions of the variables/features
Understanding the distributions of the variables/features in your dataset is critical for exploratory data analysis. This will help you understand the data better and identify any outliers or unusual behavior. The histogram is a popular method for visualizing distributions. A histogram shows how frequently each value appears in a dataset. It’s a handy tool for determining the distribution of a numerical variable.
15.Correlation
A correlation matrix is used to investigate the relationship between various variables. The correlation coefficient determines the degree to which two variables are linked. The following table depicts the relationship between salary, age, and balance. Correlation describes the relationship between two variables. This allows us to see how changes in one variable affect changes in the others.
Machine Learning Training
Weekday / Weekend Batches
Conclusion
Machine learning is a rapidly growing field with a wide range of practical applications. Before developing effective machine learning models, it is critical to first understand the data. Exploratory data analysis (EDA) is an important step in the machine learning process. EDA helps us understand the data better and identify patterns and trends that may be hidden within it.EDA can also be used to identify potential data issues. Overall, EDA is an important part of the machine learning process. By better understanding the data, we can build better machine learning models that are more likely to produce accurate results.
Related Course:

Stephan is the sports journalist for the Maple Grove Report.


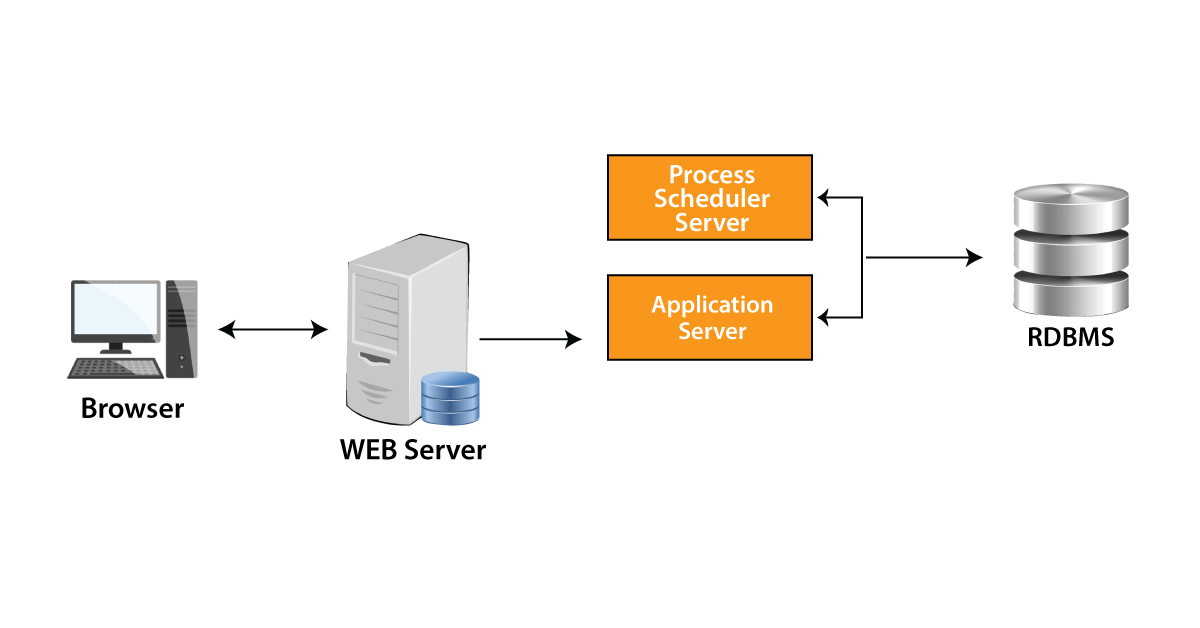

 The requests are sent by the web browser to the web server. The web server will pass the request to the application server, which will generate the SQL to be executed in the database.